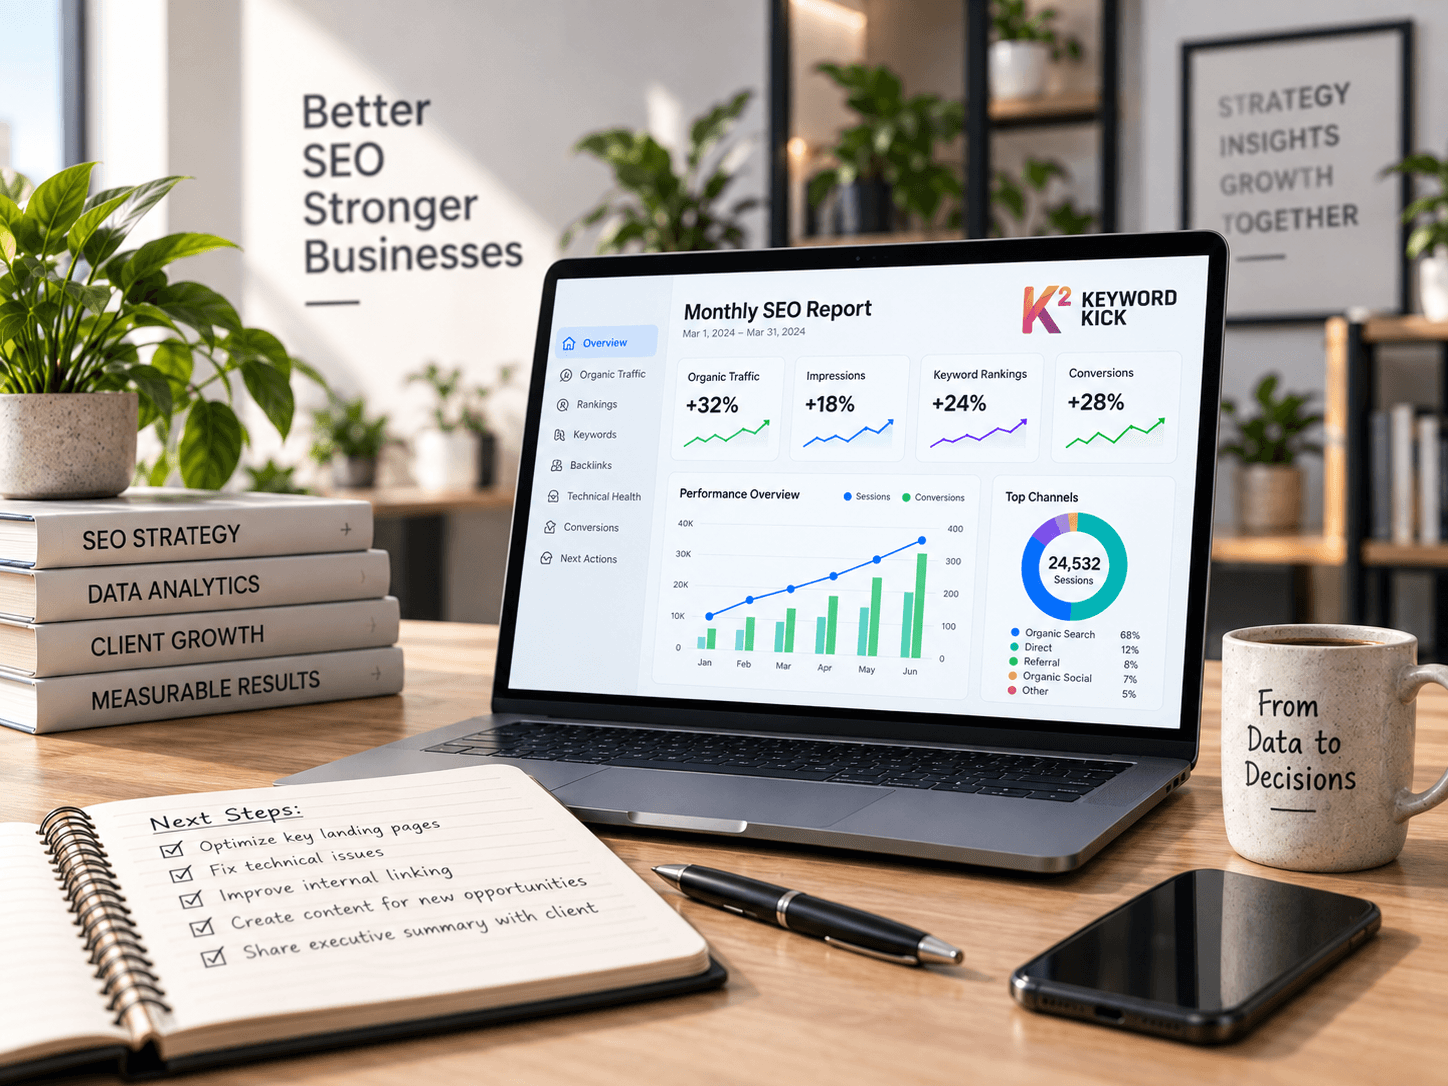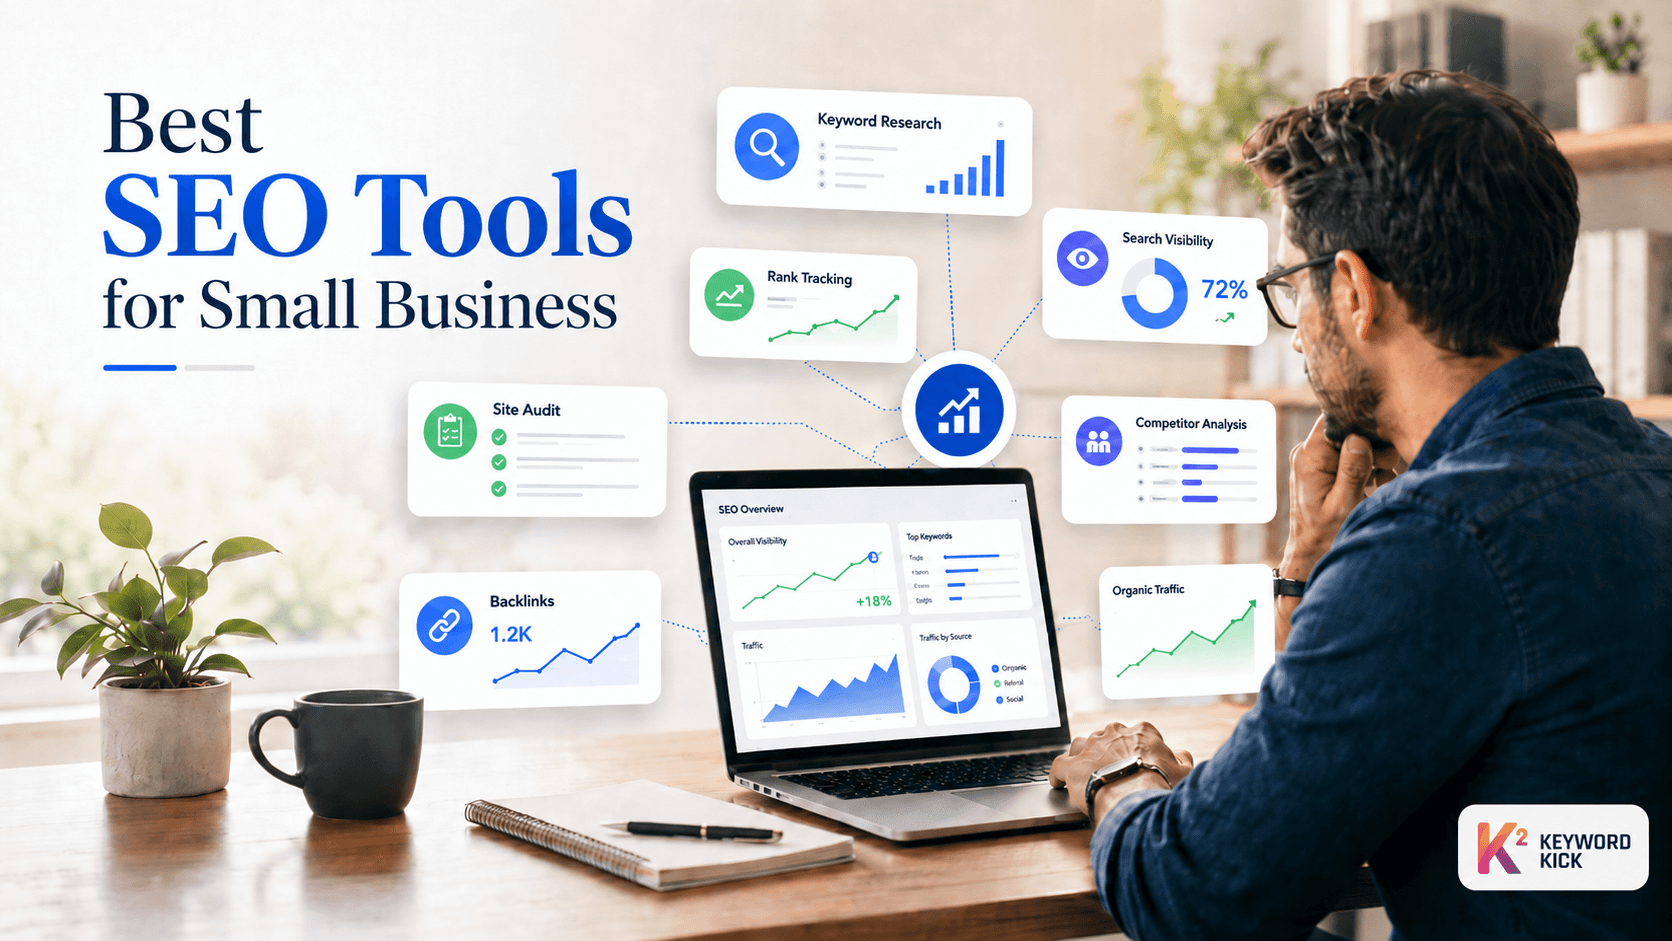
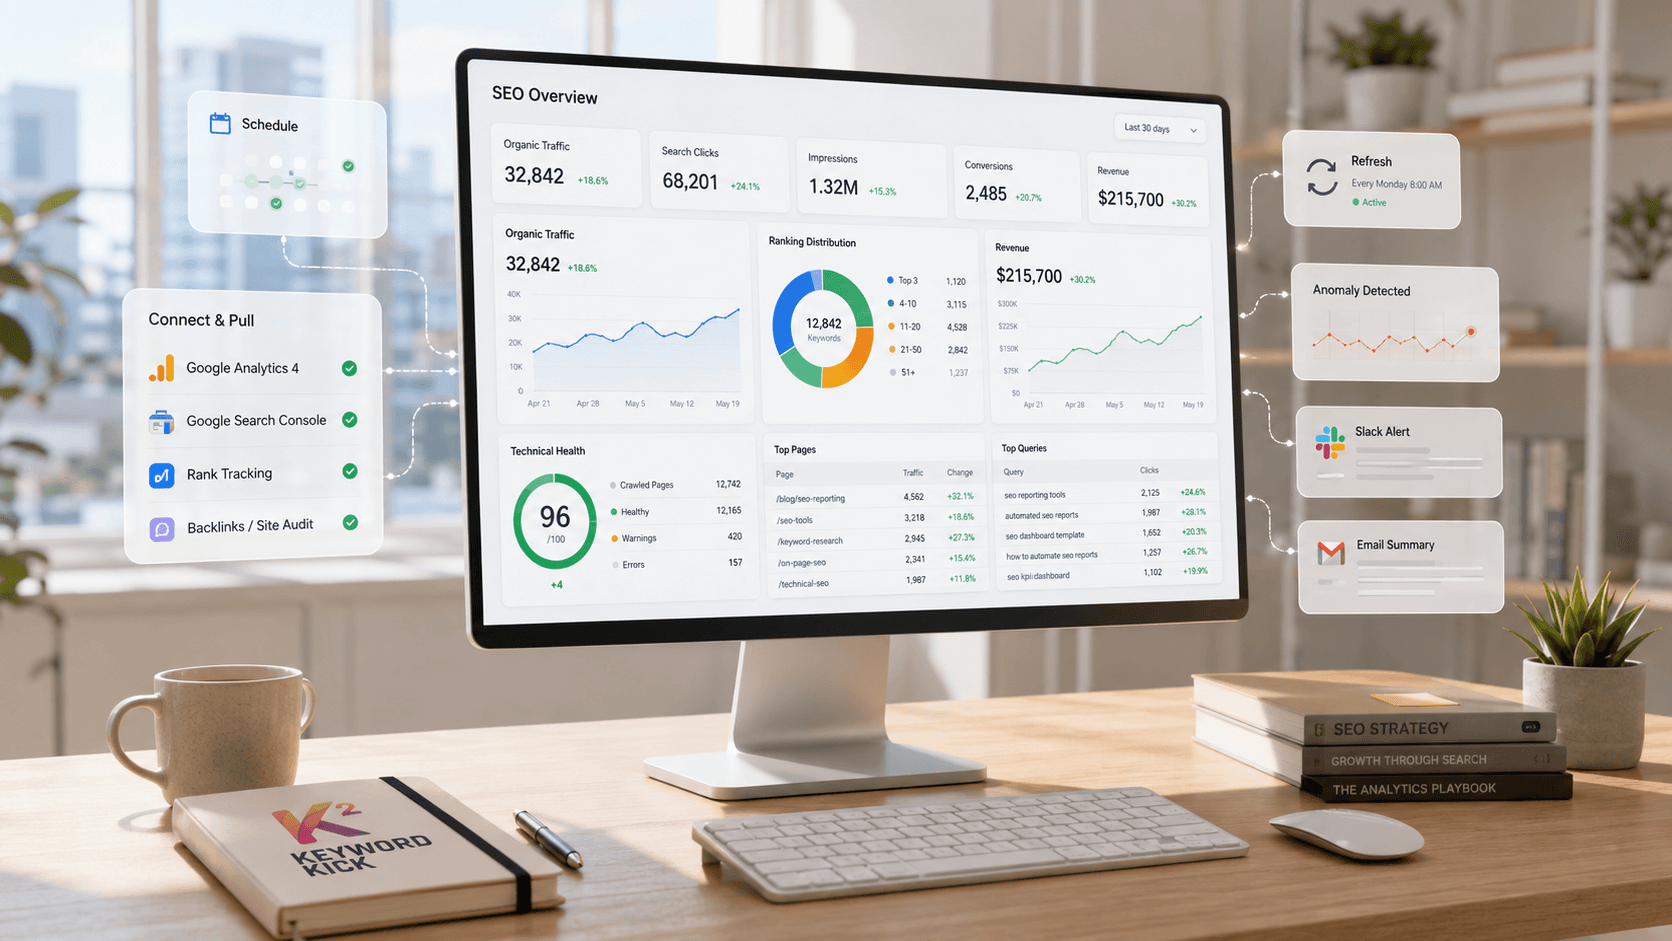
Automating your SEO reporting isn't just about saving time—it's about getting out of the data-pulling business entirely. You stop wrestling with CSV exports and screenshots and start focusing on strategy. An automated report works for you: it refreshes itself, flags problems, and frees your team to do the work that actually moves the needle.
What It Really Means to Automate SEO Reporting
Let's be clear: automating SEO reporting means replacing the manual, soul-crushing task of stitching together spreadsheets. Instead, you build scheduled, API-driven workflows that pull fresh data and surface insights on their own.
The payoff is huge. You reclaim hours each week that were lost to manual data pulls and building visuals. Your data becomes more reliable because direct connectors to tools like GA4, Google Search Console, rank trackers, and backlink tools eliminate human error. And when the numbers are always consistent, you build trust with stakeholders and spend less time answering questions about data discrepancies.
A small three-person agency I know used to spend every Monday morning exporting data and building reports. They switched to a live dashboard that updates daily. Now, anomalies trigger an instant Slack alert, and a summary email lands in their inbox at 8 AM sharp. Their total prep time for their weekly meeting dropped from 6 hours to just 45 minutes.
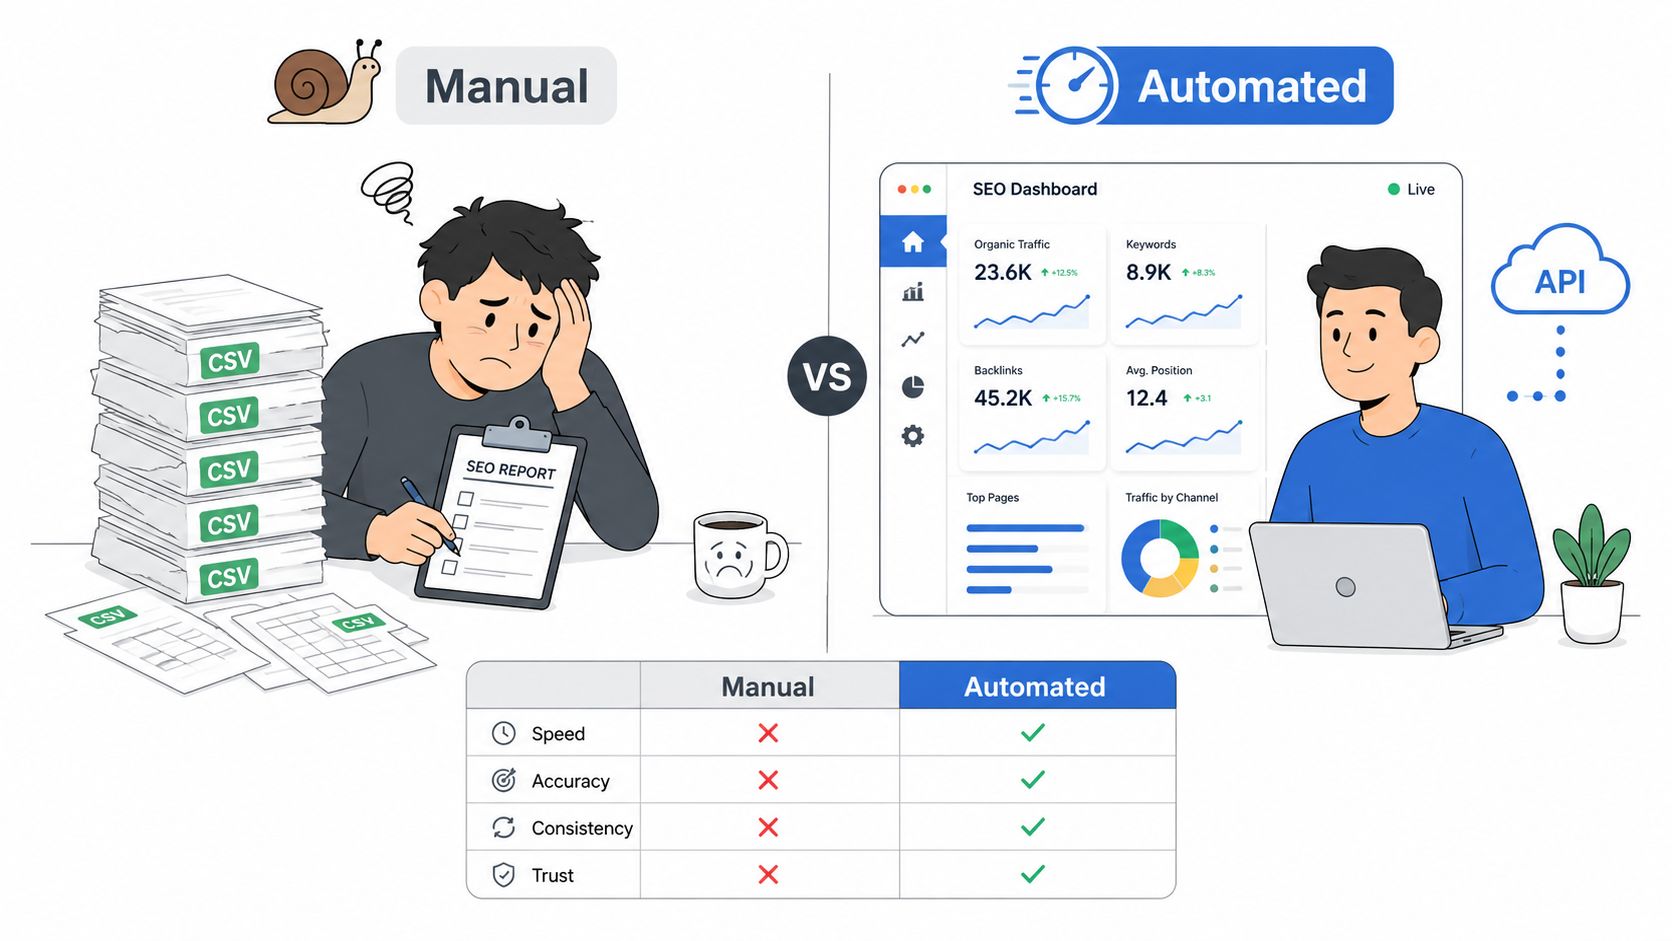
Manual vs. Automated SEO Reporting
The difference between the old way and the new way is stark. Manual reporting is a reactive chore; automated reporting is a proactive system.
Dimension | Manual Reporting | Automated Reporting |
|---|---|---|
Effort | Hours of repetitive exporting and formatting each week | Set up once, then runs automatically |
Accuracy | Prone to copy-paste errors and version control issues | API-synced data is always consistent and up-to-date |
Frequency | Typically weekly or monthly due to high effort | Real-time, daily, or on any schedule you set |
Scalability | Becomes exponentially more time-consuming with more clients or sites | Scales effortlessly—add a new site and apply the same template |
Ultimately, automation turns reporting from a backward-looking summary of what happened into a forward-looking tool for what to do next.
Key Data Sources to Connect
When building your automated dashboard, you'll want to pull from several core sources to get a complete picture of performance.
Google Analytics 4 (GA4): This is your source for user behavior and, most importantly, conversions. For an e-commerce site, you'll want to surface metrics like organic-driven revenue and transactions.
Google Search Console (GSC): GSC provides the essential top-of-funnel data: impressions, clicks, and average position. It’s perfect for spotting high-level visibility shifts before they impact traffic.
Rank Tracker: Connect your preferred rank tracking tool to monitor keyword distribution, SERP feature ownership (like featured snippets), and share of voice against competitors.
Backlink & Site Audit Tools: Feeds from tools like Ahrefs or Semrush can track new and lost backlinks and flag critical technical health issues from your latest site audit.
The secret to useful alerts is tuning them to avoid noise. Set baseline ranges and account for seasonality so your team only gets pinged for signals that actually matter.
A great way to get started is to build just two templates: a high-level executive summary and a more granular technical deep-dive. Once you've wired up your data sources, you can reuse these templates for every new client or website, letting you scale your reporting without starting from scratch every time.
Define the KPIs That Actually Drive Decisions
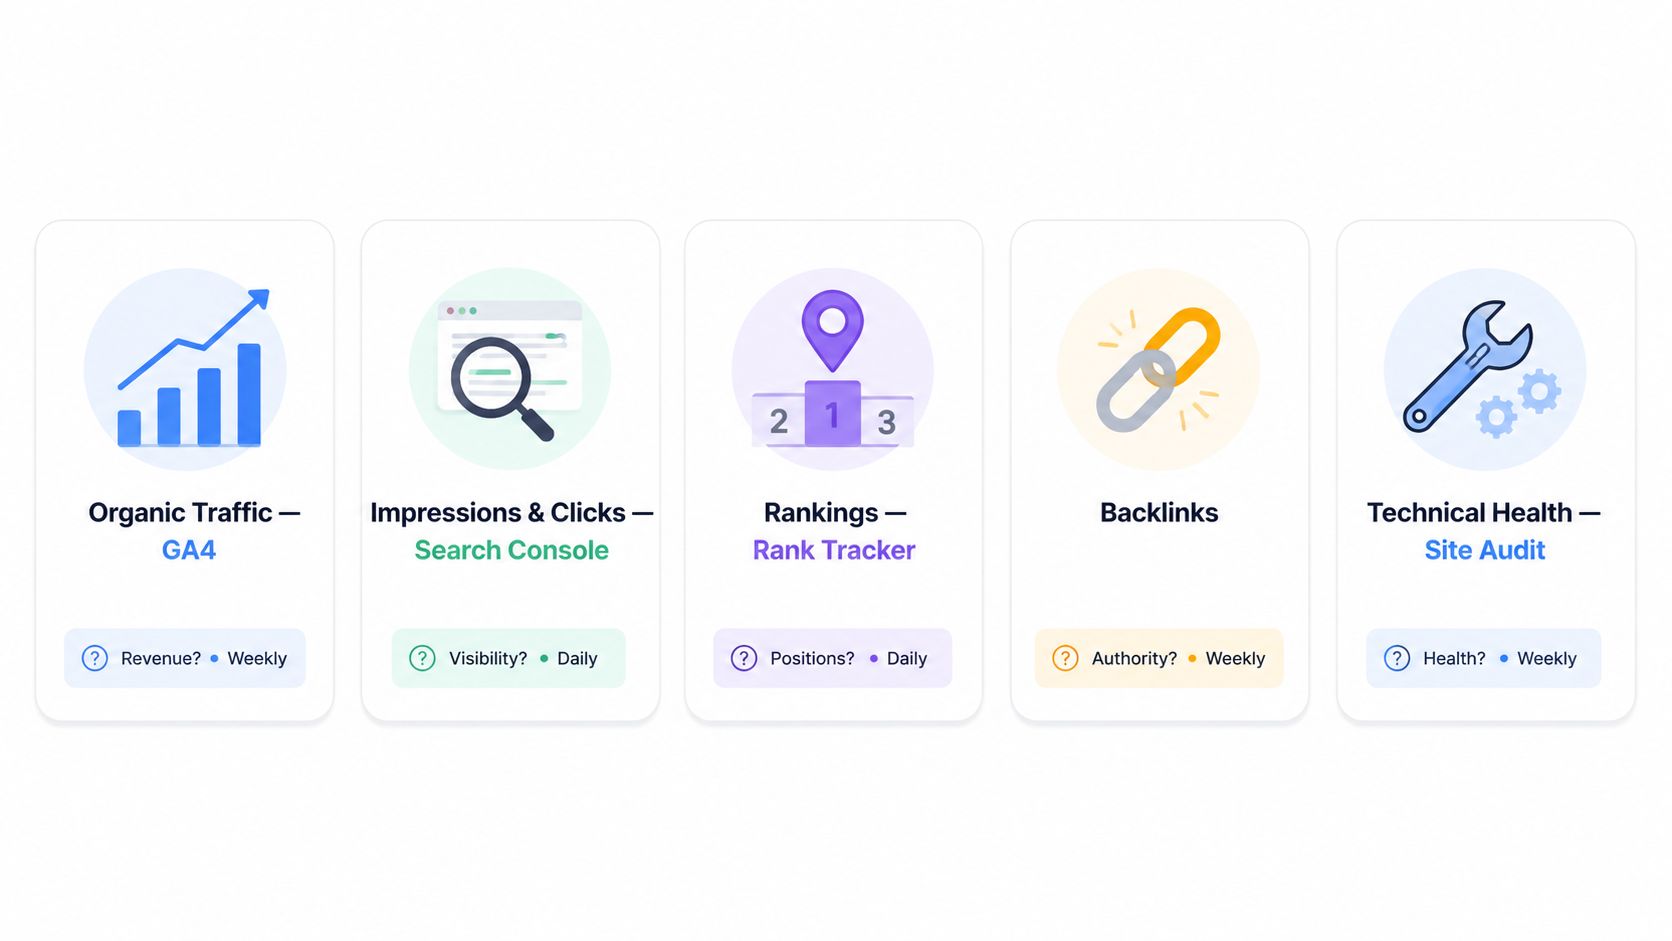
Before you automate anything, get clear on what decisions your reports need to support. That means focusing on metrics tied to revenue, conversions, or product goals — not vanity numbers that look good in a slide deck but don't change what anyone does on Monday morning.
Start with the metrics that matter most: organic revenue and transactions from GA4, impressions and clicks from Google Search Console, and ranking distribution from your rank tracker. These three alone tell you whether your SEO efforts are actually moving the business forward.
Keep your KPI set tight and document exactly how each one gets measured. That way, nobody wastes time debating definitions later. For an e-commerce client, you might track non-brand organic revenue as the north star. For a content publisher, top-3 keyword count often tells a clearer story. Different questions, same automation framework.
Core SEO KPIs Mapped to Data Sources
Here's how the most commonly tracked metrics line up with their sources, the questions they answer, and how often you should pull them:
KPI | Primary Source | Answers | Cadence |
|---|---|---|---|
Organic Revenue | GA4 | Is SEO driving actual business value? | Daily to weekly |
Impressions / Clicks / Avg Position | Google Search Console | Are we visible, and are titles earning clicks? | Daily |
Ranking Distribution (Top 3, 4–10) | Rank Tracker | How many keywords sit in visible positions? | Daily |
New / Lost Backlinks | Backlink Tool | Is link building gaining or losing ground? | Weekly |
Technical Health Score | Site Audit | Are technical issues creeping in before they hurt rankings? | Weekly |
This table gives you a starting framework. Adjust the cadence based on how volatile each signal is — revenue and rankings shift faster than backlink profiles, so they need more frequent checks.
Narrow KPIs reduce noise and improve actionability
For each KPI, add a few context fields: what specific question it answers, who owns it, and what threshold triggers an alert. This does two things — it prevents "metric creep" from bloating your dashboard over time, and it gives your automation rules clear boundaries for what gets flagged.
What This Looks Like in Practice
An agency I've seen work with dozens of clients settled on two weekly KPIs to drive their optimization priorities: non-brand organic revenue and top-3 keyword growth. That combination told them which landing pages deserved attention without drowning in data.
A publisher took a different angle — they tracked top-3 keywords and CTR by content section to decide which articles were worth expanding and which ones had hit a ceiling.
Both approaches worked because the metrics connected directly to a decision: optimize this page, or invest in this content area.
Implementation Tips That Save Headaches
Use GA4 event-driven conversions to tie specific content to actual revenue, not just traffic spikes.
Filter GSC for brand vs. non-brand impressions — brand traffic can mask real organic gains or losses if you're not separating them.
Pull volatile KPIs daily (rankings, clicks) and slower-moving signals weekly (backlinks, technical health). There's no reason to refresh a backlink report every 24 hours.
For additional guidance on choosing meaningful website metrics, this website performance KPIs technical guide covers the technical side in more depth. And if you want a broader framework for measuring SEO performance, our practical guide on How to Measure SEO Performance a Practical Guide walks through the full process.
Map Your Data Sources And Connect Them Once
Getting your KPIs hooked up to the right sources is where automation stops being a toy and starts actually earning its keep. Before you touch any dashboard, write down every metric and where it comes from. GA4 for conversions. Google Search Console for impressions and clicks. A rank tracker for position distribution. A backlink tool for link velocity. A site audit platform for technical health.
One source of truth per metric. That's it. This saves you from the nightmare of two tools showing different numbers and not knowing which one to trust.
When connecting GA4 and GSC, go with native OAuth whenever possible — it's far less headache with token refreshes down the road. For rank trackers and backlink tools, API keys tend to be simpler and more stable for scheduled data pulls. If you're juggling multiple properties, something like Keyword Kick can drastically cut down on integration work by bundling rank tracking, backlink analysis, site audits, keyword research, and SERP feature tracking in one place with daily updates and historical trends.
When to Skip the Connector and Go Direct API
Not every data source plays nice with plug-and-play connectors. Here's when you'll want to bypass them entirely:
You need a higher data pull frequency or custom dimensions that UI exports don't surface.
Your reporting pipeline depends on raw event-level GA4 data.
Rate limits or multi-account service accounts make OAuth setup too fragile to maintain.
Quick Troubleshooting Checklist
Even solid integrations break. Here's what to check first:
Expired tokens — rotate OAuth credentials and set up a monitoring check so you catch it before reports go stale.
Missing service accounts — provision and test permissions before you schedule anything.
API rate limits — implement backoff retries and break large pulls into smaller segments.
A Real-World Setup That Works
An e-commerce team I worked with piped GA4 exports into BigQuery, pulled GSC data daily, and joined it with rank-tracker API data in a single dataset. One dashboard refreshed every night. One Slack alert fired whenever non-brand revenue dipped 15% below baseline. Simple, fast, and actually actionable.
Connect once and validate often — small connection errors become big report headaches if left unchecked.
Integration Plan Template
Use this as your checklist before turning anything on:
Map KPIs to sources
Choose connector type (OAuth vs API key)
Add auth monitoring
Schedule incremental pulls
Validate daily totals against source UI
Read also: How to automate cross-tool workflows with Zapier and Keyword Kick integrations Keyword Kick Zapier guide
Build Dashboards And Templates That Scale
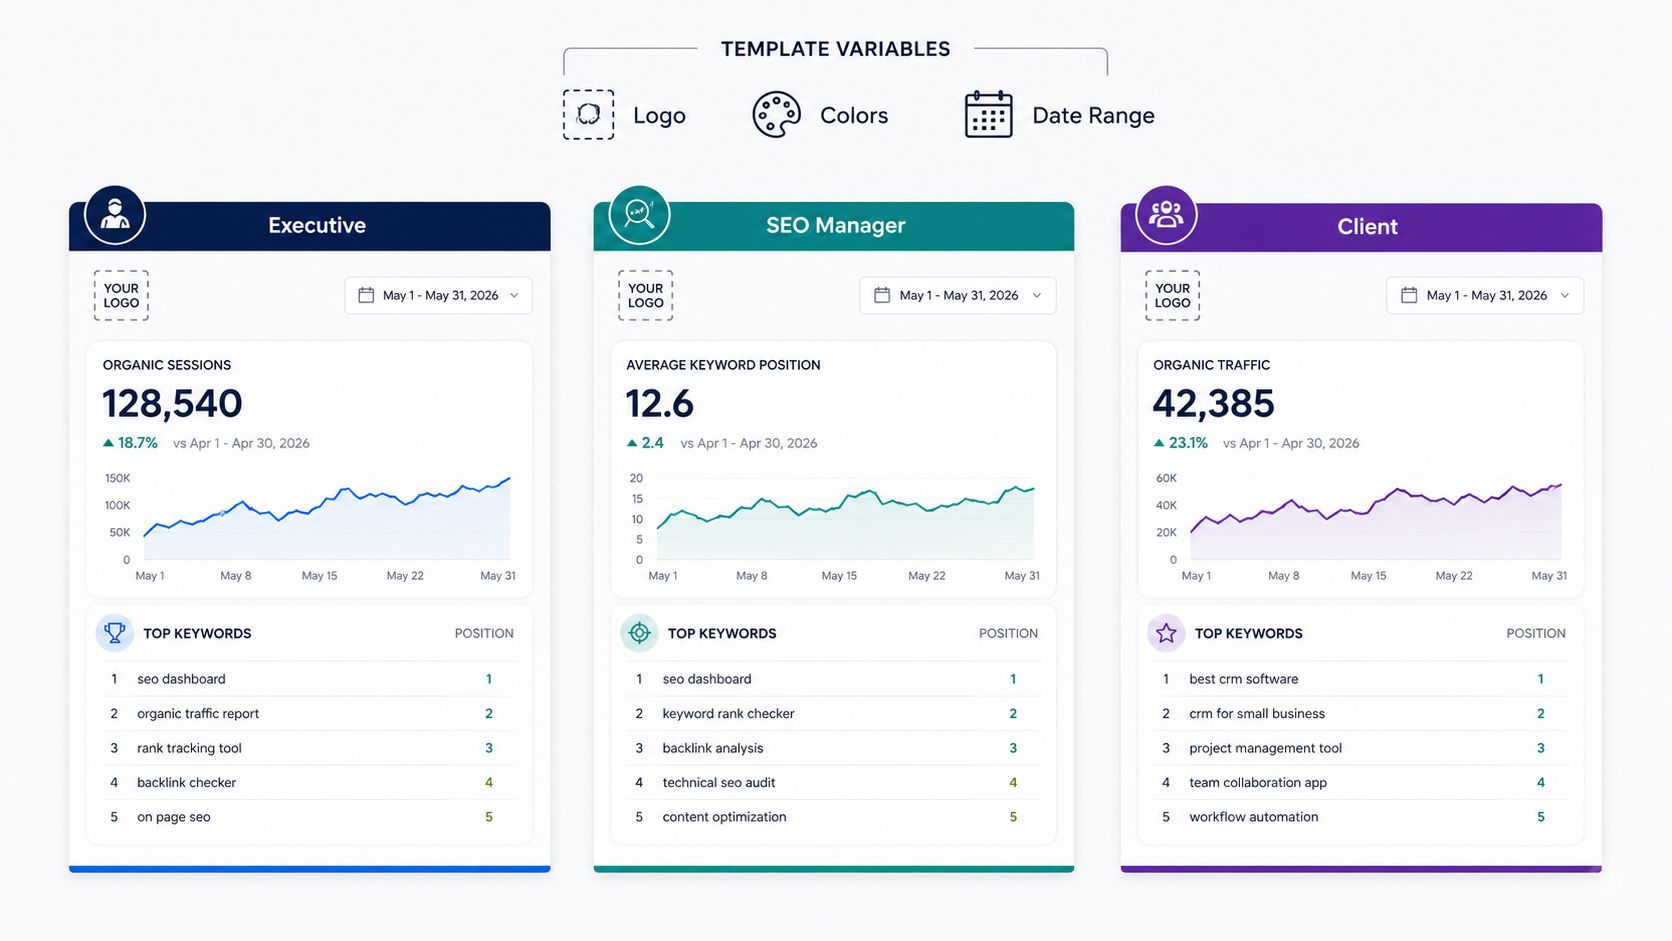
Build out three core views from the start: an executive summary, a deep dive for your SEO managers, and a clean snapshot for clients. Pull the exact same KPIs for each, but adjust the granularity. One template, multiple audiences.
Use template variables for logos, color palettes, and time ranges so you never rebuild a dashboard from scratch. Imagine an agency setup where you swap the client logo, set a 28-day range, and the widgets for non-brand revenue, top-3 keywords, and technical health stay intact. Onboarding a new client should take minutes, not days.
Layout Examples
Agency dashboard: traffic trends, ranking distribution, backlink velocity, and top technical issues—include direct links to the crawl findings.
In-house e-commerce dashboard: organic revenue by category, product page visibility, conversion rate per landing page, and keyword cannibalization flags.
Focus dashboards on decisions, not vanity. A concise executive card showing non-brand organic revenue alongside a one-line recommendation drives faster action.
Build modular widgets you can toggle on or off. Keep a core set visible by default, then add optional widgets for deeper analysis. This keeps the executive summary readable while letting your power users drill down when they need to.
When rolling out a new template, run through this checklist:
Map KPIs directly to a widget and its data source.
Set up variable placeholders for logos, timezones, and date ranges.
Assign ownership and add an action field to each widget so nothing falls through the cracks.
Test with two real accounts before pushing it out to the whole team.
Make sure your crawler supports JavaScript rendering. If it doesn't, client-side issues can quietly break your metrics as you scale. Also, default to year-over-year comparisons. Week-over-week data is too noisy and often leads to reactive decisions based on normal fluctuations.
Automated reports only matter if they drive action. Focus on surfacing clear, actionable insights rather than just raw data dumps. If you want to dig deeper into building dashboards that actually influence decisions, explore this guide on how to build analytics dashboards that drive decisions.
Finally, version your templates and keep a gallery of them. Your team should be able to clone and adapt existing dashboards instead of building new ones from a blank canvas.
Schedule Delivery, Alerts, and Anomaly Detection
Scheduling is what turns automated reporting from a weekend chore into something that actually shows up useful every morning. The trick is matching your delivery cadences to how stakeholders actually work. A Monday 6:00 AM data pull, an 8:00 AM send, and a monthly strategic recap tends to hit the sweet spot. This LowCode Agency pattern gives teams enough breathing room to review flagged items before they walk into meetings.
Different audiences need different things. Executives want weekly or monthly email summaries with one-line takeaways. Engineers prefer weekly deep dives dropped into a shared dashboard and Slack channel. And for pitches or audits, you'll want one-click on-demand exports ready to go.
Trigger-based automation is where things get genuinely useful. Fire a report when organic sessions drop 15% against baseline. Or when average position for a money keyword slips three spots. Tie each alert to an owner and include a suggested next step so nobody's left staring at a problem wondering what to do with it.
Set alert rules with an owner, a threshold, and a cooldown window so things don't ping endlessly
Route delivery by channel: email for summaries, Slack for urgent flags, PDF for client-facing reports
Always include contextual links back to the live dashboard and the underlying GA4 or GSC view
Anomaly Detection and Tuning
Good anomaly detection needs baselines and seasonality baked in. Compare against rolling medians and year-over-year values so you're not scrambling every time there's an expected dip. The real move is flagging only events that cross both an absolute and a relative threshold. That keeps noisy signals from overwhelming your team.
Tune thresholds aggressively. A quiet inbox beats fifty false alarms that train people to ignore everything.
Practical examples:
Agency setup: A nightly run joins GSC clicks with rank tracker changes. Slack alert fires if top-10 keyword count drops by 10%.
In-house ecommerce: Daily non-brand revenue check. Email and SMS go out if revenue drops 20% and conversion rate dips at the same time.
Best Practices Checklist
Schedule data pulls before stakeholder sends
Assign clear ownership and action steps for every alert
Use combined absolute and relative thresholds
Add cooldown windows to prevent repeat pings
Review alert performance monthly and adjust baselines
Start with conservative rules and measure alert accuracy for about four weeks. Then tighten or relax thresholds based on what you see. That steady tuning loop prevents burnout and keeps your automated SEO reporting system something people actually pay attention to.
Advanced Automation With APIs, Scripts, and Pipelines
Once you've decided to automate SEO reporting, the real question becomes whether to lean on low-code tools or write custom code. A lot of teams do just fine with Zapier or Make for event-driven alerts and simple data joins. If your data team needs granular joins, high-frequency pulls, or warehouse-level loads, you'll want to work directly with the Search Console API, GA4 Data API, and rank tracker APIs.
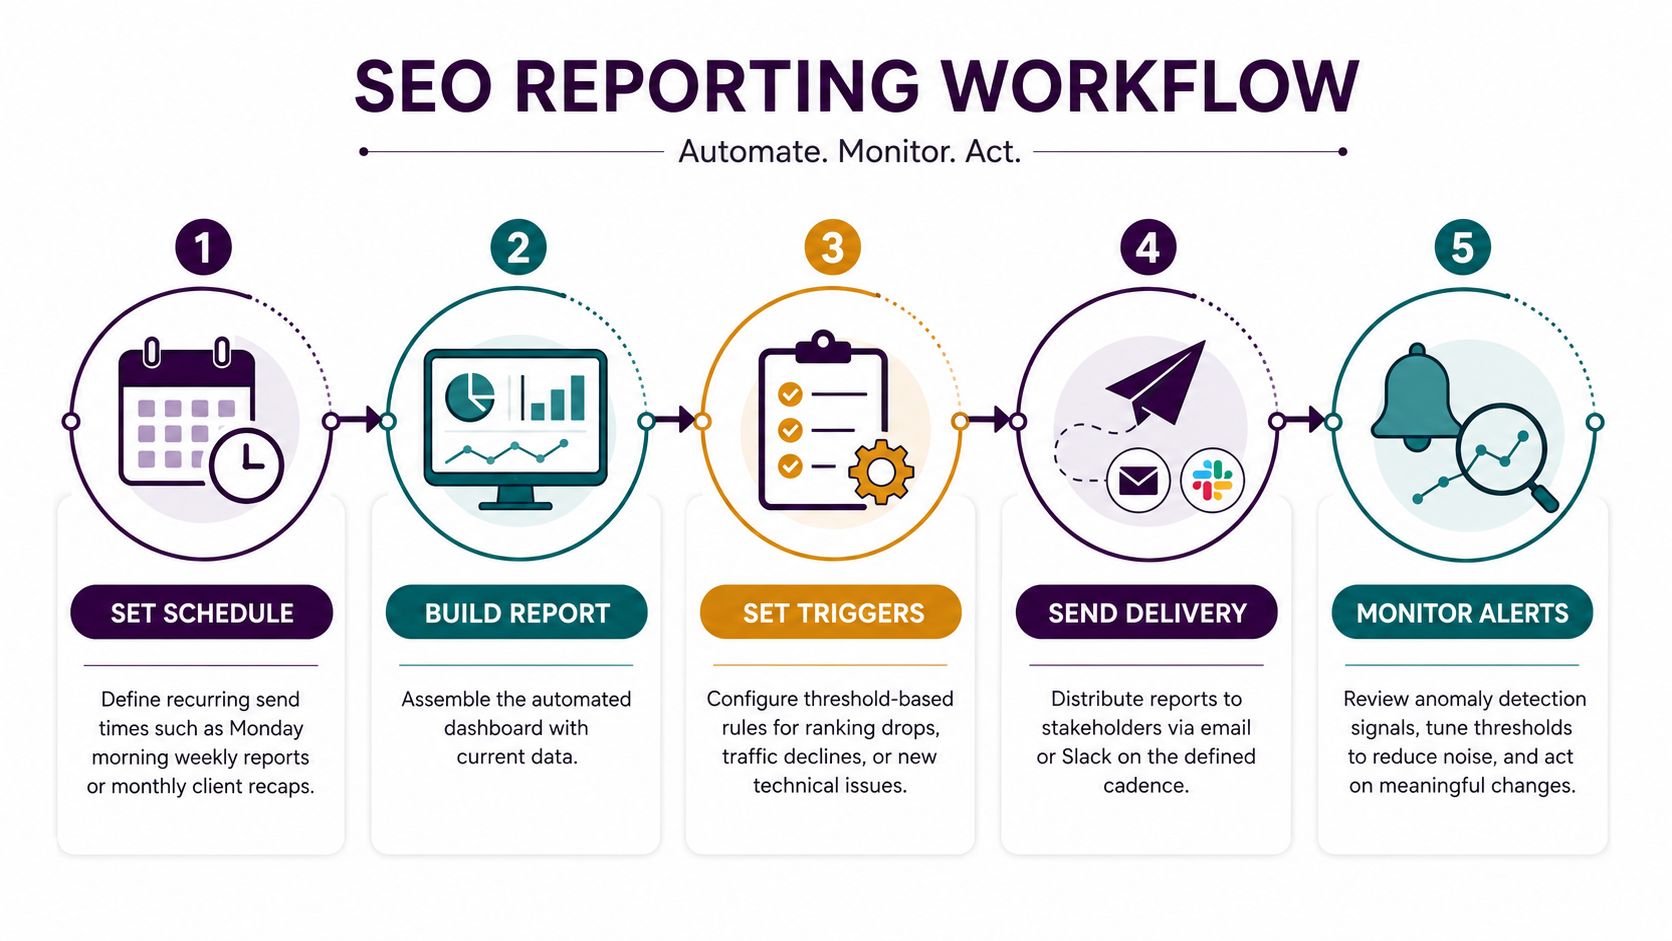
That workflow breaks down into five stages: scheduling, report building, triggers, delivery, and monitoring. It's basically a blueprint for designing reliable report delivery and alerting.
The core takeaway? Scheduled pulls, threshold triggers, and feedback loops hold the whole system together. You plan your cadence, automate data transforms, and tune your alerts so reports stay genuinely useful instead of flooding your inbox with noise.
When To Use Low Code Versus Scripts
The choice usually comes down to team size and complexity:
Low-code tools shine when you need fast setup and easy integrations. They're perfect for Slack notifications, email alerts, and teams without dedicated data engineers.
Scripts make sense when you need custom joins, backfills, BigQuery or warehouse loads, and CRM joins for pipeline attribution.
Real example: A small agency might use Zapier to refresh a Looker Studio report and post Slack alerts on rank drops. An enterprise team, on the other hand, pipes GA4 into BigQuery, joins GSC and rank data with CRM via Python ETL, and powers daily dashboards off the results.
Start with simple rules, then graduate to scripts when you need repeatable joins, retries, and audit trails.
Practical Pipeline Steps
Extract data from APIs with incremental windows. Pulling everything from scratch every time wastes time and quota. Incremental pulls — last 7 days, last 24 hours — keep things fast and efficient.
Transform in a sheet or warehouse and document every field. This is where joins happen, naming conventions get standardized, and someone downstream actually understands what "clicks_ga4_final_v3" means. Document it.
Load into your dashboard and schedule refreshes. Connect your transformed data to whatever reporting tool your stakeholders actually look at. Set a refresh cadence that matches how often decisions get made.
Trigger distribution and alerts with owners and cooldowns. Every alert needs a human owner. And every alert needs a cooldown so you're not getting pinged for the same threshold breach twelve times before lunch.
Tips and Governance
Version control your scripts and store schema docs where people can actually find them.
Add threshold tuning notes and an audit trail for every alert you set up.
For advanced data collection beyond what official APIs offer, it's worth understanding what scraping APIs do as a supplement.
If you're working on API-driven rank tracking specifically, this resource covers implementation patterns and connector details: Read also: How Keyword Kick Handles API Rank Tracking https://www.keywordkick.com/solutions/api-rank-tracking
Frequently Asked Questions About Automated SEO Reporting
How often should reports run for agencies versus in-house teams?
Most agencies end up settling into a hybrid cadence because nobody needs the same thing at the same frequency. Daily data pulls for rankings and clicks keep you in the loop without anyone manually checking. Weekly executive snapshots give clients a digestible view. And monthly strategy recaps tie everything back to bigger-picture goals.
In-house teams tend to simplify: daily monitors for high-impact KPIs like organic revenue, plus weekly synthesized reports that feed into cross-team planning sessions.
What belongs in a minimum viable automated report for a small business?
Three tight metrics, no more. Non-brand organic revenue from GA4. Impressions and clicks from Google Search Console. Top-10 ranking distribution from a rank tracker.
Then add one actionable insight per metric and assign an owner to each item. The whole point is that the report leads to a decision — if nobody's acting on it, you're just generating noise.
Can a free tier plus a short trial really get you started?
Absolutely. A solid free plan plus a 7-day trial gives you enough runway to validate connectors and test basic templates. Use that window to confirm your GA4 and GSC syncs are actually pulling the right data, run a template end-to-end, and verify your alert rules fire correctly. If the foundation doesn't work on a free tier, no amount of paid features will fix it.
How do you handle stakeholders who want raw data instead of dashboards?
Give them both. A polished dashboard for most stakeholders, and a downloadable CSV or direct BigQuery view for the data-hungry ones. The key is tying that raw export back to the same KPI definitions so everyone's referencing identical fields — otherwise you end up with three versions of "conversions" and a lot of confused meetings.
When should you escalate from low-code tools to custom scripts and APIs?
When your needs outgrow what the no-code layer can handle. Repeatable joins across data sources. Incremental pulls instead of full reloads. Backfills after schema changes. CRM joins that low-code tools simply can't do reliably.
If you also need audit trails, versioned ETL, or high-frequency pulls that hit API rate limits, that's your sign to build an API-driven pipeline. It's more upfront work, but it removes the fragile workarounds that slow you down later.
Keep every report tied to KPI, source, and cadence so automation stays actionable, not noisy.
If you want a turnkey option that connects GA4, GSC, rank tracking, backlinks, and audits with daily updates try Keyword Kick https://www.keywordkick.com