Monday morning, the organic traffic chart is down and the team is already asking which title tags to rewrite. That reaction is understandable, but the chart alone can't tell you whether demand fell, rankings slipped, Google changed the result layout, or analytics stopped attributing visits correctly. Treating every decline as a content problem wastes the first hours when diagnosis matters most.
SEO traffic analysis is the discipline of separating those causes before you prescribe a fix. The workflow below uses Search Console, Google Analytics, indexing data, rank history, query intent, and SERP features to turn a vague traffic alarm into a ranked list of testable actions.
What SEO Traffic Analysis Actually Means in 2026
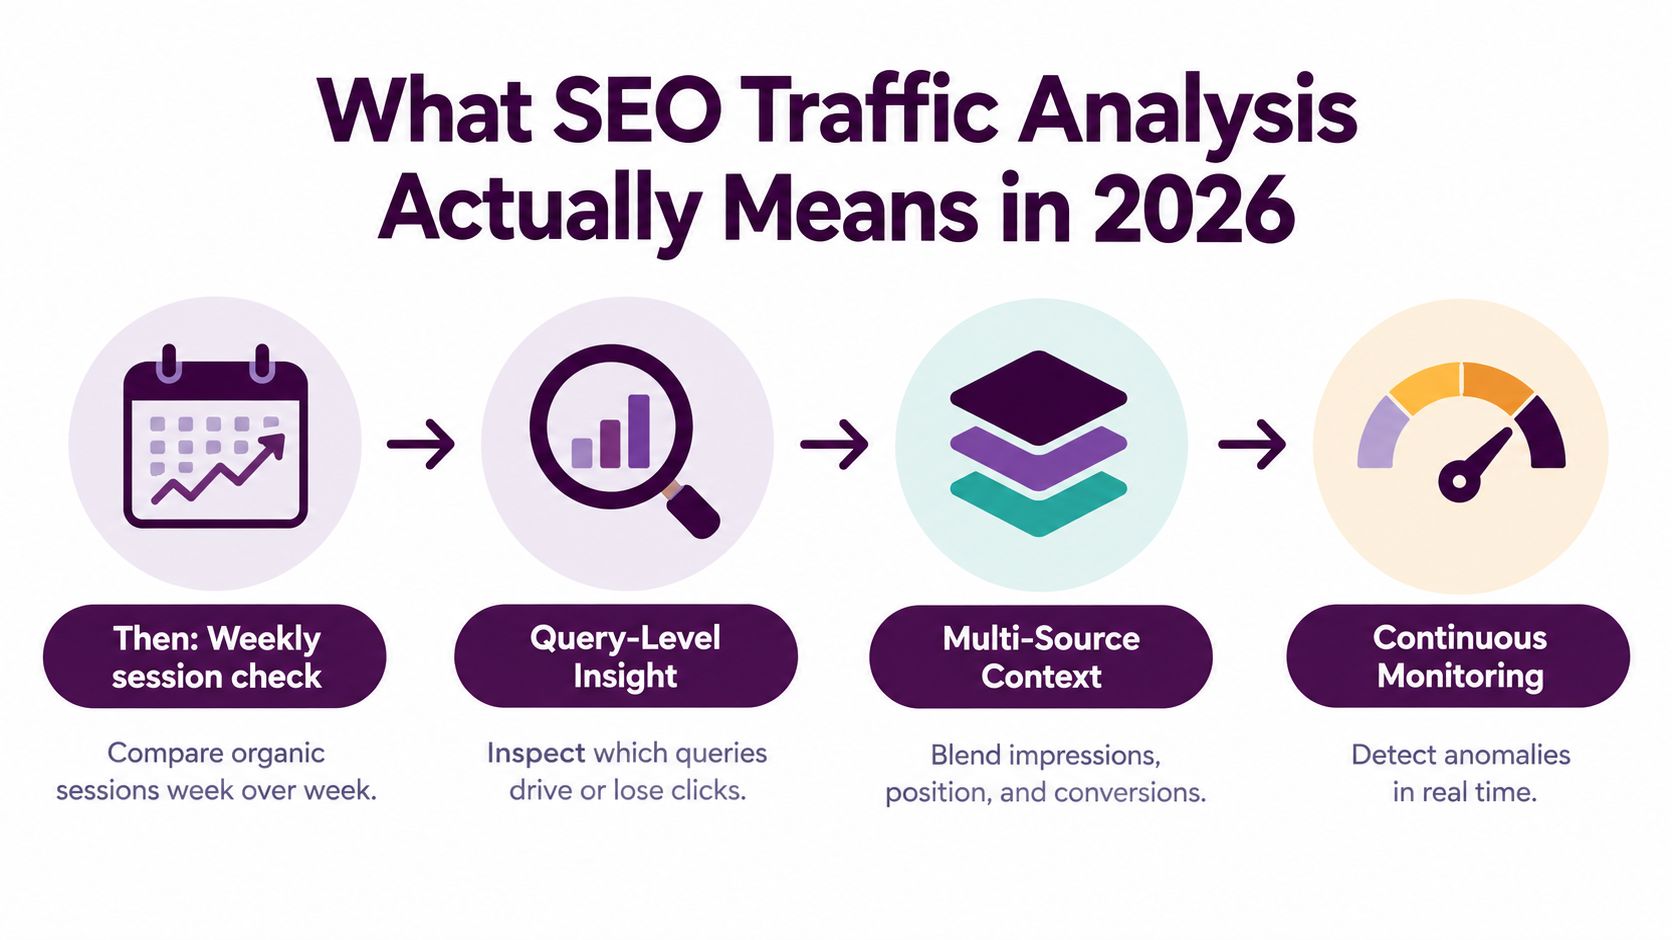
A few years ago, many teams treated SEO traffic analysis as a weekly export. Open Analytics, compare organic sessions with the previous period, add a chart to the report, and explain the movement. That process still describes what happened, but it rarely explains why.
Search behavior now creates several different paths to the same traffic decline. A page can lose clicks because its ranking deteriorated, because a featured result or AI Overview answers the query before the user reaches the page, or because demand for the query itself weakened. Those causes look almost identical in an aggregate sessions report, yet they require different decisions.
Organic search remains a major acquisition channel. A widely cited industry summary reports that organic search accounts for 53.3% of trackable website traffic, compared with about 5% from social media and roughly 15% from paid search, based on a BrightEdge study covering billions of sessions across thousands of domains. The same summary cites a Conductor analysis in which organic search generated about 33% of overall website traffic across seven industries. See the industry traffic benchmark summary for the underlying context.
The four questions behind every traffic change
A reliable investigation follows four phases:
- Confirm the signal. Establish that the decline appears in Search Console and Analytics, and that the comparison window is valid.
- Attribute the cause. Separate demand, rankings, indexing, tracking, and SERP layout effects.
- Segment the loss. Break results down by page, query, intent, device, country, brand status, and search appearance.
- Route the finding. Convert the diagnosis into a prioritized fix or a monitored hypothesis.
That order matters. If impressions are stable but clicks fall, publishing more content may solve nothing. If valid indexed pages disappear, improving copy on an affected URL won't restore visibility. If branded queries remain stable while non-branded queries decline, the business may still have demand while competitors or search features capture discovery traffic.
Practical rule: Never approve an SEO fix from a sessions chart alone. Require a page, query, impression, position, and CTR view first.
The first organic result has historically captured a disproportionate share of clicks. A 2026 summary cites an average CTR of 27.6% for position one, 15.8% for position two, and 11.0% for position three, which explains why a small ranking movement can produce a substantial traffic change even when search demand remains steady. The click distribution benchmark provides the cited context.
The Metrics That Matter and the Ones to Ignore
Most dashboards lead with sessions because sessions are easy to understand. They're also incomplete. A total can confirm that traffic changed, but it can't identify whether a page lost visibility, whether a query changed intent, or whether attribution broke after a site release.
Start with metrics that distinguish the three main forces, rankings, SERP layout, and demand. In practice, that means reading Search Console and Analytics together rather than treating either platform as a complete source of truth.
Build the diagnostic layer first
Track indexed pages against submitted sitemap URLs to catch broad indexing changes. Compare impressions and average position at landing-page level, because ranking erosion can appear before clicks decline. Then split CTR by query intent, since a stable position with a falling CTR often points toward a changed results page rather than weaker relevance.
Brand status is another essential cut. Branded queries usually reflect existing awareness, while non-branded queries expose discovery and competitive visibility. A decline concentrated in non-branded impressions suggests a different response from a decline affecting branded and non-branded searches together.
Use conversions and qualified outcomes as the final filter. A page that loses low-intent clicks but retains assisted conversions may deserve a different response from a commercial page losing high-value entrances.
A practical metric comparison
| Metric | What It Tells You | When To Use It |
|---|---|---|
| Indexed pages vs. submitted sitemap URLs | Whether important URLs remain eligible for search | After migrations, releases, redirects, or sudden sitewide declines |
| Impression-weighted average position | Whether visibility is weakening before clicks reveal it | During early ranking erosion or competitive movement |
| CTR by intent bucket | Whether users are choosing your result at the same visibility level | When rankings hold but clicks fall |
| Branded vs. non-branded clicks | Whether the issue concerns demand or discovery | During market changes, brand campaigns, or competitor pressure |
| Landing-page impressions | Which URLs carry the decline | When the aggregate trend hides page classes |
| Total organic sessions | The size of the observed traffic change | As an opening signal, never as the diagnosis |
| Domain authority or rating score | A third-party proxy, not a traffic explanation | Use only as supporting competitive context |
| Time on page | On-site behavior after the click | Useful for engagement analysis, weak for explaining acquisition loss |
| Composite SEO score | A blended diagnostic shortcut | Avoid as a decision metric |
A useful companion is Trendy's performance analysis tips, particularly when you need to connect page-level traffic observations with content decisions. For a broader measurement model, use Keyword Kick's performance guide to define the relationship between visibility, traffic, and outcomes.
Don't put domain rating, bounce rate, or a composite “SEO score” at the center of an executive explanation. Those numbers may have a role in a wider report, but they don't answer the operational question: which cause should the team investigate next?
Diagnosing Traffic Drops Step by Step
When an alert fires, resist the urge to edit a page. Run the same sequence every time so the team doesn't confuse urgency with evidence.
Confirm the comparison
Open the Search Console Performance report and set the affected date range against a prior period of equal length that doesn't overlap it. Google recommends using the Compare tab and checking the wider history available in Search Console so seasonal patterns don't look like unexpected losses. Its guidance also recommends comparing equivalent days and using the same number of days in each period. Follow the Google Search Console traffic-drop workflow before drawing a conclusion.
Filter the report by queries, pages, countries, devices, and search appearance. If the decline appears across nearly every page and query, investigate a systemic issue. If it clusters around one template or directory, inspect that content type and its technical delivery.

Cross-check the measurement layer
Compare Search Console clicks with organic landing-page sessions in Google Analytics. Search Console measures search visibility and clicks, while Analytics helps verify what users did after arriving. If Search Console is stable but Analytics drops sharply, inspect consent changes, tagging, redirects, channel grouping, and recent releases before changing SEO content.
Google describes Search Console as the diagnostic layer after Analytics reveals a major organic traffic change. Its guidance on using Analytics and Search Console together is useful when the two sources disagree.
Next, inspect indexing. Review the Pages report, validate important money URLs, check noindex directives and status codes, and compare valid indexed pages with the submitted sitemap. A page can render normally for a human and still be excluded from search because of an accidental deployment.
Read position and CTR separately
A CTR decline with stable average position points toward a changed SERP environment, weaker snippet appeal, or feature displacement. A position decline with stable CTR suggests competitive pressure, relevance changes, or an algorithmic shift. Both metrics falling together usually warrants a closer page and query review rather than a single metadata edit.
Finally, annotate the timeline with migrations, template releases, manual actions, security events, major content changes, and known search updates. For additional ideas on content and link strategies for 2026, use the recommendations as inputs to testing, not as proof that a particular tactic caused your decline.
Segmenting Traffic by Intent and SERP Feature
Organic traffic is a collection of jobs users want to complete. A flat total hides whether people are learning, comparing, buying, or returning to a known brand.
Create intent labels for informational, commercial investigation, transactional, and navigational queries. You can classify them from query wording, landing-page type, existing keyword taxonomy, and conversion paths. Then compare impressions, clicks, CTR, and position for each segment across the affected period.
Add the result-page context
Intent alone isn't enough. A commercial query can lose clicks because competitors outrank the page, while an informational query can lose clicks because Google answers the question directly in the results. Track exposure to featured snippets, People Also Ask, image packs, local results, and AI Overviews where your data source supports those labels.
A page that remains in a top organic position but loses CTR needs a different intervention from a page that falls beyond the visible results. For snippet-eligible queries, changing structure, definitions, tables, and concise answer blocks may be more relevant than adding another long section. For transactional terms, review price, availability, category structure, internal links, and competing result types.
| Intent Segment | SERP Feature | Diagnostic Signal | Likely Cause |
|---|---|---|---|
| Informational | Featured snippet or AI Overview | Impressions hold while CTR declines | The result answers more of the query before the click |
| Informational | People Also Ask | Position holds, feature visibility rises | Users may satisfy adjacent questions on the results page |
| Commercial investigation | Review or comparison features | Clicks weaken across comparison queries | Competitors or richer result formats attract attention |
| Transactional | Shopping or local features | Category impressions remain, CTR falls | SERP real estate redirects clicks to specialized results |
| Navigational | Sitelinks or brand features | Branded clicks remain stable | The demand likely persists, so investigate non-brand loss elsewhere |
Keep a matrix with columns for intent, feature exposure, affected URLs, and proposed action. You can also monitor search features with Keyword Kick when you need rank history and SERP changes beside query data.
Zero-click behavior makes this segmentation more important. Independent 2026 coverage reports that 58.5% of U.S. Google searches and 59.7% of EU searches ended without an external click, while another source reported 68.01% of U.S. searches ending without a click during the first four months of 2026. These figures come from separate analyses summarized by Relevant Audience's zero-click coverage, so don't merge them into one benchmark. The operational lesson is consistent: evaluate impressions, brand visibility, assisted conversions, and feature presence alongside clicks.
Prioritizing Fixes and Building a Testing Workflow
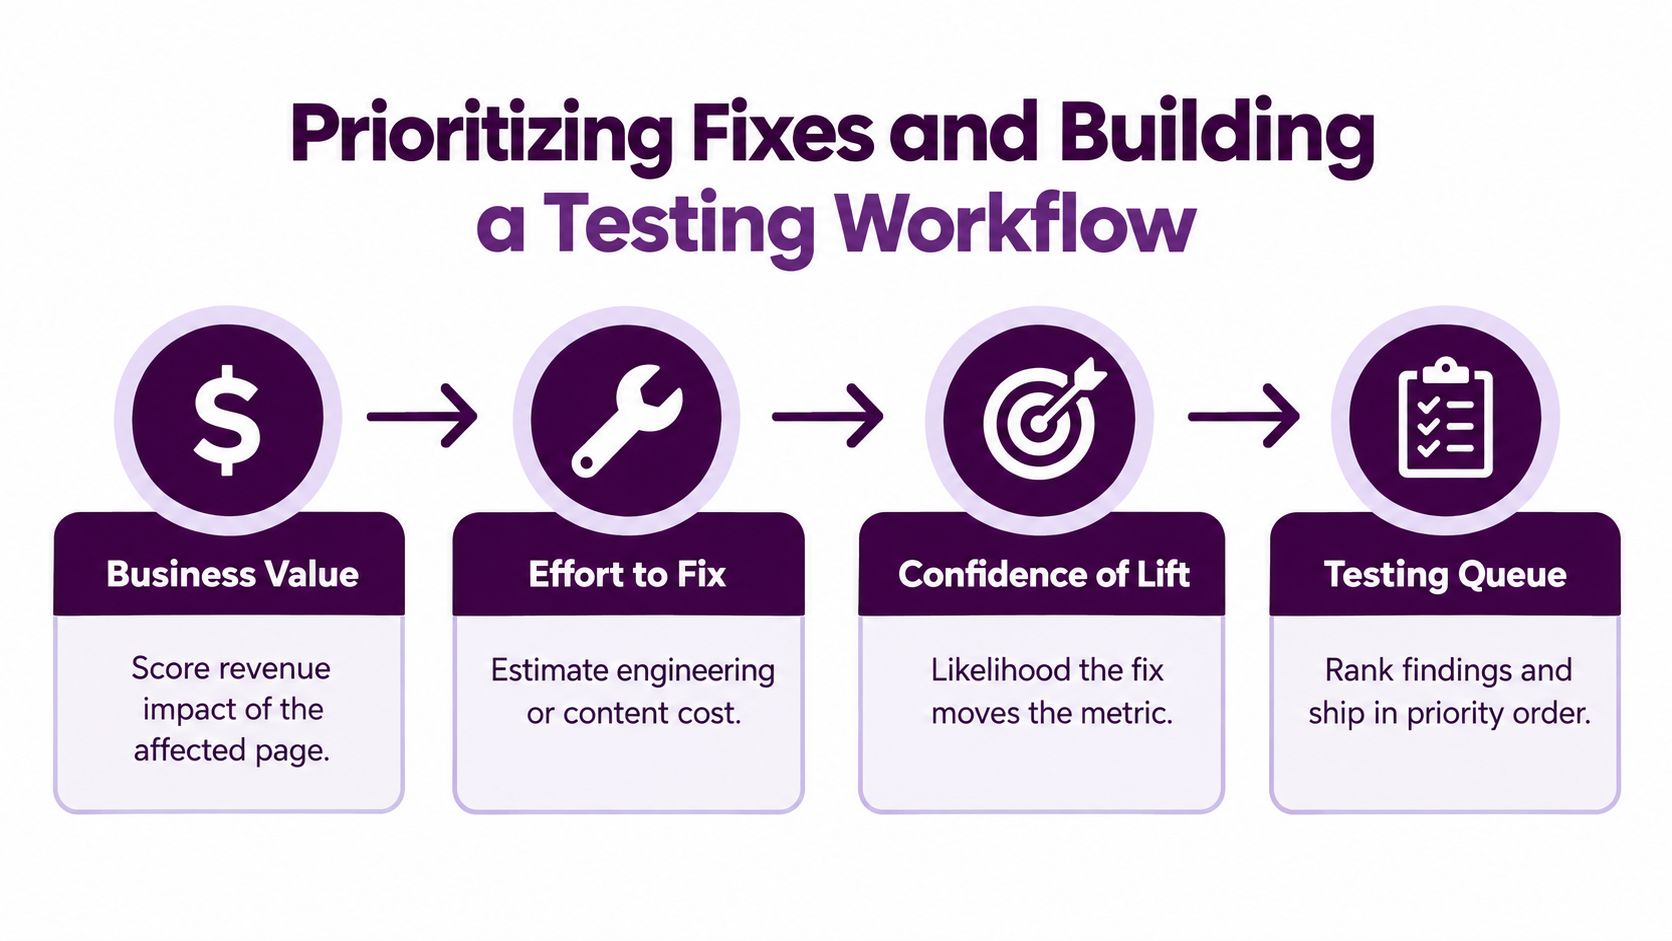
A diagnostic report becomes useful when it tells someone what to do first. I rank each finding by business value, effort, and confidence, then remove low-confidence, low-value observations from the active sprint.
Business value reflects the page's role, not its traffic volume alone. A commercial landing page with modest visits can outrank a popular informational article if it influences qualified demand. Effort includes engineering, content, design, approval, and deployment dependencies. Confidence asks whether the evidence supports the proposed change.
Score the action, not the symptom
Create a queue with one row per finding. Include the affected URLs, query segment, suspected cause, current evidence, owner, effort estimate, and expected metric movement. A broken canonical signal and a weak title tag shouldn't compete for attention without that context.
Decision rule: If you can't name the metric the change should move, the item isn't ready for the sprint.
Turn the strongest findings into hypotheses with one primary variable. Examples include:
- Snippet test: Rewrite the title and meta description for a stable-ranking page whose CTR declined.
- Structure test: Add a concise answer block and supporting headings to a page losing snippet-eligible informational clicks.
- Internal-link test: Add contextual links from relevant high-visibility pages to a declining commercial URL.
- Content test: Expand missing comparison or decision criteria where query intent and page coverage don't align.
- Technical test: Correct indexing, canonical, redirect, or status-code problems before touching the copy.
Record outcomes on a fixed cadence
Use a control page or comparable page set where possible, define the success metric before launch, and record the start date. Review at consistent checkpoints, such as 14 and 28 days, but interpret the result according to search volume, page type, and the time needed for Google to recrawl and reassess the change.
Don't promote a tweak because clicks rose briefly after publication. Promote it when the target metric improves against a reasonable baseline and no broader change explains the movement. Keep inconclusive tests in the log. They prevent the team from repeating the same assumption later.
Running the Workflow Inside an Integrated Platform
The practical problem usually isn't access to data. It's the handoff between systems. An analyst checks Search Console, switches to Analytics, opens a rank tracker, checks a crawler, updates a spreadsheet, and then tries to remember which evidence supports each recommendation.
An integrated workspace can reduce that friction by keeping query, URL, traffic, rank, backlink, and technical signals together. The tool doesn't replace judgment. It makes the evidence available while the diagnosis is still fresh.
A realistic Monday setup
The first saved view should show:
- Organic landing pages with a material decline against the chosen comparison period.
- Search Console clicks, impressions, CTR, and average position for each URL.
- Branded and non-branded query tags.
- Intent labels and SERP feature exposure.
- Conversion or assisted-conversion fields from Analytics.
- Open technical findings associated with each affected URL.
I'd then group URLs by content type and filter for pages where impressions remain present but CTR has weakened. A second view would isolate pages with falling impressions and declining position. Those are different queues, and combining them creates noisy recommendations.
Keyword Kick can connect Google Analytics 4, Google Search Console, rank tracking, backlinks, and technical SEO signals in one workspace. Use it as one option for reducing manual joins, then export the prioritized queue with the evidence and assign an owner to each action.

The first report view shouldn't be a glossy executive dashboard. It should be an investigation screen. Include the affected URL, query cluster, comparison window, impression change, click change, position change, CTR change, intent, feature, conversion context, and technical status in the same table.
That setup lets the analyst move from “traffic is down” to “non-branded commercial pages retained impressions, lost CTR, and gained a competing SERP feature” without rebuilding the question across several tools.
Turning Analysis Into Action Every Week
A repeatable cadence keeps SEO traffic analysis from becoming an emergency exercise.
Monday is for diagnosis. Produce a traffic delta summary, validate the comparison window, and publish a segmented query and landing-page report. Mark demand, visibility, indexing, tracking, and SERP feature hypotheses separately.
Wednesday is for prioritization. Score findings by business value, effort, and confidence. Assign owners, define the target metric, and move weak evidence into a monitor list rather than the sprint.
Friday is for review. Update the test results log, record what changed, and note whether the evidence supports, weakens, or fails to answer the hypothesis. Documentation matters because otherwise the team repeats old experiments and mistakes correlation for cause.
Avoid four recurring errors: fixing one page before checking for a systemic issue, blaming every dip on an algorithm change, hiding brand and non-brand movement inside one total, and reporting activity instead of outcomes.
Pin this checklist to the project board:
- Baseline segmentation: Separate pages, queries, intent, brand status, and SERP features.
- Anomaly thresholds: Define what triggers an investigation.
- Comparison snapshots: Schedule consistent period-over-period reviews.
- Hypothesis logging: Record every change and its observed outcome.
- Monthly pattern review: Look for recurring page classes, causes, and missed opportunities.
SEO traffic analysis works when it changes decisions. Start with the signal, isolate the cause, prioritize the response, and keep the result in the record.
Keyword Kick brings Google Analytics 4, Google Search Console, rank tracking, backlinks, and technical SEO signals into one workspace for this diagnostic workflow. Visit Keyword Kick to connect your data, investigate traffic changes by page and query, and turn the next alert into an assigned action queue.