

Most advice about website analytics metrics tells you to track more. That's how dashboards become graveyards of numbers: a real-time users panel nobody acts on, an all-traffic source list too long to interpret, and a multi-channel funnel report that creates discussion without creating decisions. More data doesn't produce better judgment when no owner knows what to change.
Revenue decisions need fewer metrics, sharper definitions, and a clear action window. Every number on your dashboard should answer one question: what will a stakeholder do within the next seven days because this moved? If the answer is nothing, remove it from the weekly view.
Google Analytics has shaped the industry's measurement habits since its launch in November 2005, after Google acquired Urchin. By 2026, independent estimates put Google Analytics on roughly 43% to 55% of all websites, with about 28.5 million total sites using a version of the product and about 14.7 million using GA4 specifically (Digital Applied's Google Analytics statistics). That scale makes GA4 familiar, but familiarity creates a dangerous habit: teams trust a label before checking what the platform counts.
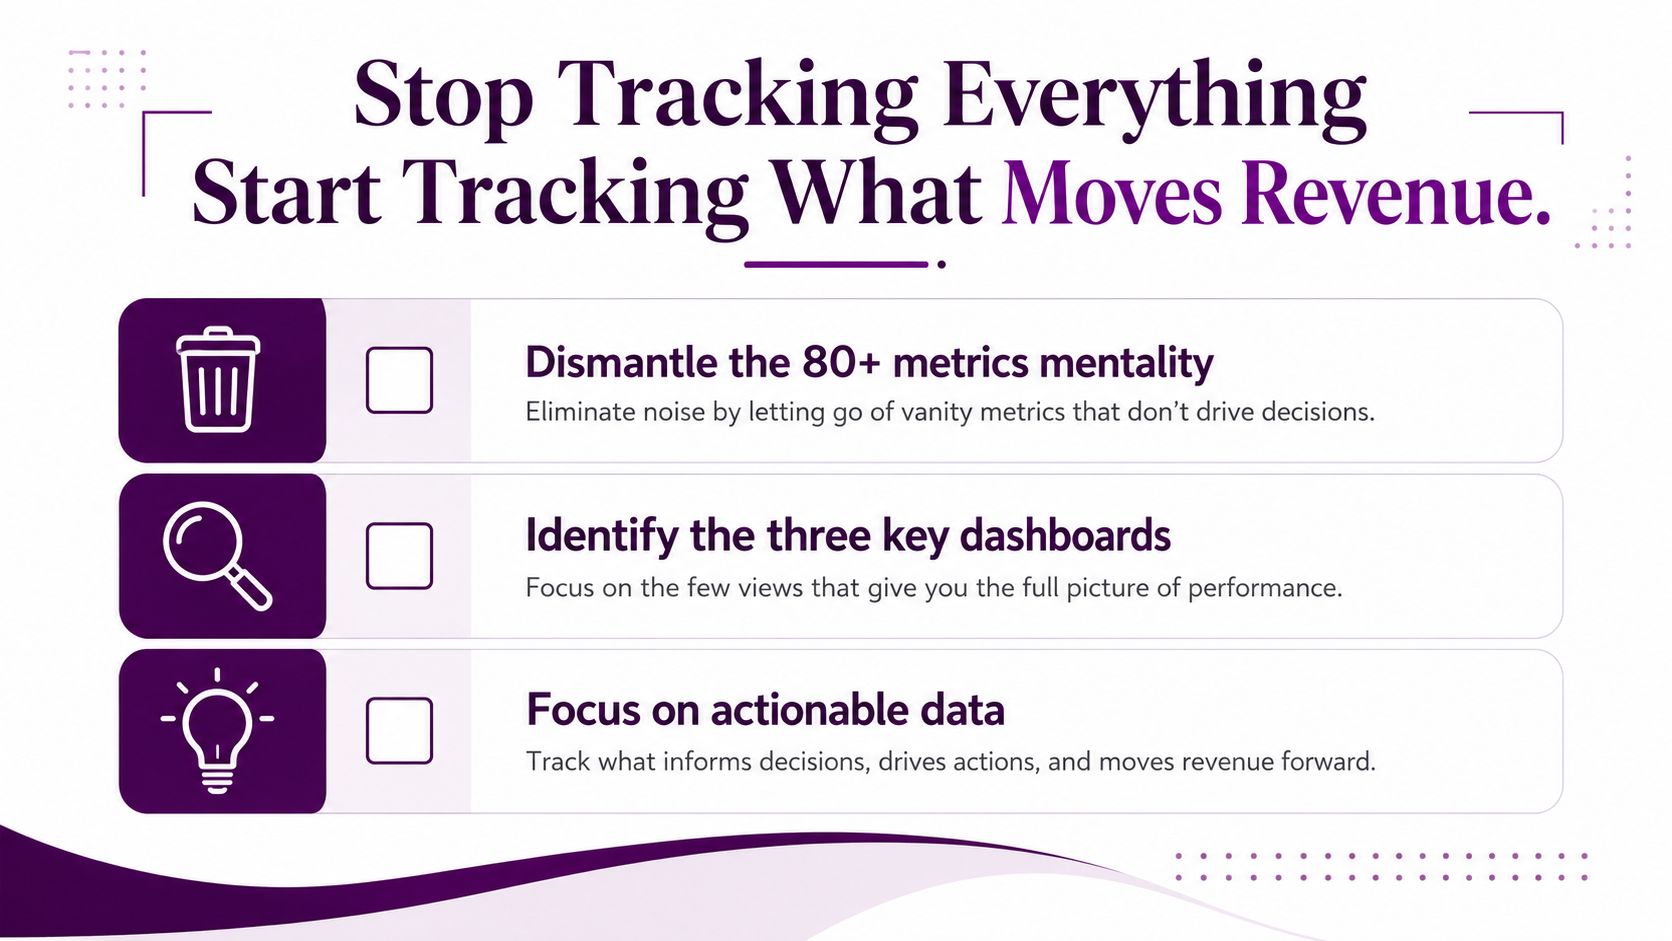
Stop Tracking Everything Start Tracking What Moves Revenue
The “track everything” mindset feels rigorous, but it usually hides weak prioritization. Teams stare at real-time users, hoping a spike will validate a campaign. They scan the all-traffic sources report, even when fifteen or more channel rows lead to no budget or content decision. They open the multi-channel funnel report, debate attribution, and close it without assigning a test.
Those reports aren't useless. They're poor default destinations for a weekly revenue review. A real-time count can confirm that tracking is active, but it rarely tells you whether visitors are qualified. A channel list describes acquisition volume, but not whether a source creates pipeline. A funnel report can illuminate paths, but it can also encourage teams to explain the past instead of improving the next landing page.
Advisor rule: If a metric has no owner, no decision, and no action date, it doesn't belong in the operating dashboard.
Start with the business decision, then choose the metric. A growth lead deciding whether to increase paid spend needs conversion rate by source, cost per acquisition, and revenue quality. An SEO manager deciding which page to update needs organic clicks, ranking context, engagement, and conversions for that page. A product team investigating activation needs engaged sessions, key events, and downstream account behavior, not a larger users tile.
The filtering test is simple:
Decision: What choice will this number inform?
Owner: Which person can change the underlying experience?
Time frame: Can that person act within seven days?
Guardrail: Which business outcome prevents local optimization from causing damage?
GA4 adds another reason to be disciplined. Its definitions for active users, engaged sessions, events, and conversions can make a dashboard look healthier or weaker depending on implementation. A rise in engagement rate might reflect better navigation, faster loading, or a measurement change. A fall in users might reflect identifier loss rather than a genuine audience decline.
The rest of your analytics system should therefore do more than report movement. It should connect movement to a decision, expose interpretation traps, and tell a named team what to investigate first.
The Foundational Website Analytics Metrics Every Team Should Know
Foundational metrics matter because they describe the size and shape of demand. They don't deserve automatic priority. Users represent people or identifiers recognized by GA4, sessions represent visits, pageviews represent page or screen views, and events represent tracked interactions such as clicks, form starts, purchases, or scroll activity.
Operational meaning matters more than the label. A user count helps you understand reach, but it isn't a customer count. A session count helps you understand visit volume, but it isn't qualified demand. A pageview count can reveal content consumption, but it doesn't prove that anyone found the page useful.
GA4 also changes familiar assumptions. A session can begin at midnight, even if a visitor remains active across that boundary. A user is counted through an available identifier, so one person using multiple devices may appear as more than one user. Conversely, privacy controls and limited identifier access can reduce person-level continuity. Use raw users as context, not as the headline business outcome.
The complete web analytics guide for 2026 provides broader measurement context, while Next Point Digital's dashboard guide is useful when you're deciding how to arrange ecommerce reporting around sales actions rather than disconnected tiles.
A practical interpretation table
Metric | What Teams Assume | How GA4 Actually Counts | Operational Read |
|---|---|---|---|
Users | Every real person is counted once | GA4 relies on available identifiers and active-user logic | Compare with purchasers, leads, or CRM-qualified accounts |
Sessions | Every visit follows a simple visit boundary | Session behavior is affected by GA4 rules, including midnight boundaries | Use sessions to assess demand, then qualify them |
Events | Every interaction is equally valuable | GA4 records configured events, but teams decide which matter | Separate diagnostic events from business events |
Pageviews | More views mean stronger performance | GA4 counts page or screen views, regardless of commercial value | Pair views with engagement and conversion outcomes |
Academic web analytics literature treats total visits, unique visitors, bounce rate, and average session duration as foundational behavioral measures, not merely dashboard decorations. The established definitions help explain why traffic can rise while engagement weakens, or why a page can attract visitors without producing action (the 2022 metric comparison summarized by WP Statistics).
Set actionable comparison rules rather than chasing generic benchmarks. A repeated movement across comparable periods, landing pages, devices, or channels deserves investigation. A one-off change around a holiday, campaign launch, tracking release, or reporting boundary may be noise. For weekly work, favor metrics tied to qualified sessions, unique purchasers, engaged sessions, and CRM outcomes over an isolated user total.
Engagement and Conversion Signals Decoded
GA4's engagement model is useful only when you understand its trigger conditions. An engaged session lasts at least 10 seconds, includes at least one conversion event, or contains at least two page or screen views, according to Google's GA4 engagement documentation. That definition is materially different from the old Universal Analytics bounce logic, so copying old interpretations into the new interface creates bad diagnoses.
GA4's bounce rate is effectively the inverse of engagement rate. A high bounce rate isn't automatically a failure. A help page may answer a question in one visit. A contact page may give a visitor the phone number they need. The same result on a paid landing page, pricing page, or homepage can signal poor message match, weak navigation, slow rendering, or an unclear next step.
Conversion rate is only as trustworthy as the event configuration behind it. GA4 counts events marked as conversions, now commonly called key events in reporting contexts, rather than the goal-completion model many teams remember from Universal Analytics. If a low-value interaction is marked as a conversion, your rate can rise while qualified pipeline stays flat.
Read the signal before changing the page
Signal | GA4 Definition | Common Misread | Action Threshold |
|---|---|---|---|
Engaged sessions | A session meeting the time, conversion, or page-view condition | “Engaged” means the visitor showed buying intent | Investigate when it moves without a matching change in qualified actions |
Bounce rate | The share of sessions that weren't engaged | Every bounce is a lost opportunity | Review page intent, source, and device before changing copy |
Conversion rate | Conversions divided by the selected denominator, based on configured events | Any marked event equals commercial success | Act when qualified conversions weaken, even if event volume holds |
Key events | Events selected as business-significant actions | Every tracked event deserves KPI status | Remove events that don't influence revenue or pipeline decisions |
The most useful pairing is engagement rate plus conversion rate, segmented by landing page and source. High engagement with weak conversion points toward offer clarity, CTA placement, form friction, or qualification problems. Weak engagement with weak conversion points earlier in the journey, often at message match, page speed, or content structure.
For practical CRO diagnosis, connect this measurement view with the CRO playbook for improving conversion rates. Don't react to a single percentage in isolation. Compare the page's purpose, audience, device mix, event setup, and downstream sales quality before you ship a fix.
Reading Acquisition Channels Without Fooling Yourself
A GA4 channel label isn't a perfect record of the marketing effort that produced a visit. It reflects source information, medium values, referrer data, campaign tagging, and classification rules. Treating the label as ground truth is how teams celebrate “direct” growth that came from untagged email, messaging apps, copied URLs, or dark social sharing.
Organic search is usually easier to interpret when Search Console clicks, landing pages, branded queries, and non-brand queries are reviewed together. A rise in branded organic traffic may reflect demand created elsewhere, not an SEO content win. Direct traffic deserves the same skepticism. This guide to direct traffic in Google Analytics is useful when source loss makes the direct bucket expand.
Referral traffic can include partners, publishers, aggregators, review sites, and other destinations that pass a referrer. A referral row may therefore indicate distribution, comparison research, or an unplanned listing, not a relationship your team manages. Paid social often depends on maintained UTM parameters. If campaign tagging breaks, paid visits can drift into another channel or become difficult to distinguish from organic social.
Compare channels by decision value
Channel | What GA4 Includes | Bounce Rate Typical | Engaged Sessions/Conversion | Common Misread |
|---|---|---|---|---|
Organic | Visits classified from unpaid search | Depends on query intent and landing page | Judge with non-brand clicks and qualified conversions | Branded lift is credited entirely to SEO |
Paid | Tagged or platform-associated paid visits | Depends on targeting and message match | Compare conversion quality with acquisition cost | Volume is treated as efficiency |
Direct | Visits without reliable campaign or referrer data | Often mixed and hard to interpret | Validate with landing pages and assisted signals | Untracked campaigns are called loyalty |
Referral | Visits with an identifiable referring site | Varies by context and placement | Review partner quality and downstream actions | Every referrer is treated as a partnership |
Visits correctly tagged from email links | Often influenced by returning audiences | Compare clicks with qualified outcomes | Untagged email disappears into direct | |
Social | Visits classified from social sources or UTMs | Varies by audience and content format | Separate organic and paid where possible | Reach is mistaken for intent |
The same bounce rate can be healthy for a direct-answer article and alarming for a product landing page. The same average engagement time can indicate careful research in B2B or distraction in ecommerce. Read channel metrics against landing-page intent, audience quality, conversion rate, and cost per acquisition, not against a universal “good” number.
Privacy changes make attribution less precise. Referrer-policy adoption rose from 32% in 2024 to 37.66% in 2025, which can reduce referrer visibility and weaken source analysis (HTTP Archive privacy research). Build decisions around aggregates, tagged campaigns, and CRM-confirmed outcomes rather than pretending every session has a complete identity trail.
Technical and On Page Metrics That Quietly Drain Conversions
Teams often blame a conversion decline on copy, pricing, or ad quality before checking whether the page became slower or unstable. That order is backwards. A delayed hero element, a layout shift beneath a form, or a broken mobile interaction can reduce the number of people who reach the persuasive content at all.
The technical metrics are familiar: Largest Contentful Paint, Interaction to Next Paint, and Cumulative Layout Shift. LCP measures the loading experience of the main visible content. INP reflects interaction responsiveness. CLS captures visual instability. The practical thresholds supplied for this framework are clear: LCP above 2.5 seconds on mobile templates, CLS above 0.1 site-wide, and checkout-adjacent exit rates above 70% should trigger a fix rather than another copy debate.
Put technical and behavioral evidence together
Metric | Source | Healthy | Investigate | Fix Now |
|---|---|---|---|---|
LCP | PageSpeed Insights or field data | At or below 2.5 seconds | Above 2.5 seconds on important mobile templates | Repeatedly slow monetized templates |
CLS | Core Web Vitals tooling | At or below 0.1 | Above 0.1 across important templates | Layout movement near CTAs or forms |
Exit rate | GA4 page and funnel analysis | Appropriate to page intent | Elevated on a key journey step | Above 70% near checkout or lead completion |
Scroll depth | GA4 event setup or behavior tooling | Reaches the content and CTA purpose | Sharp drop before the main argument | Important CTA sits below the visibility floor |
CTA click-through | GA4 event reporting | Consistent with page intent and traffic quality | Engagement holds but clicks weaken | High-intent page loses action without a tracking explanation |
Don't ask whether LCP or scroll depth matters more. Ask which one appears first in the causal chain. A slow hero can discourage scrolling. Lower scroll depth can hide the proof and CTA. Fewer engaged sessions can then depress conversion rate.
Check exit pages by lost conversions, not by exit volume alone. A high-exit article may have completed its job if it answers a narrow question. A lower-traffic form step can deserve immediate engineering attention if visitors abandon there after showing commercial intent.
GA4's default event setup may not capture the scroll milestones or CTA clicks you need. Instrument the interactions that support a decision, then validate tags in a test environment and compare event behavior with page performance data. Measurement quality is part of conversion optimization, not an administrative detail.
Building a KPI Stack That Matches Your Team
A shared dashboard sounds aligned until every team is judged on numbers it can't influence. SEO can't directly control checkout completion. Product can't rewrite an organic title during the same sprint. Leadership shouldn't make budget decisions from a metric that stops at the browser instead of reaching the CRM.
Give each team one primary metric, two supporting metrics, and one guardrail. The primary metric defines the team's immediate job. Supporting metrics explain movement. The guardrail prevents local optimization from damaging revenue quality or customer experience.
Assign ownership by influence
SEO: Use non-brand organic clicks from Google Search Console as the primary signal, supported by clicks landing on pages ranking in the top three positions and qualified conversions. Guard against traffic growth that produces no commercial value.
Content: Make engaged sessions on pillar pages the primary signal. Use scroll depth and assisted conversions as supporting evidence. Guard against publishing content that attracts broad but irrelevant audiences.
CRO and product: Make conversion rate on monetized steps primary. Use checkout or form abandonment as supporting diagnostics, with average order value as a guardrail where applicable.
Leadership: Use revenue per session or qualified pipeline per thousand sessions. These measures connect website activity to the outcome finance teams recognize.
GA4 benchmarks can help with selected normalized metrics such as engagement rate, bounce rate, average session duration, and conversion rate. Google presents them as peer-group percentiles, including the median, 25th percentile, and 75th percentile, and estimates unnormalized ranges using active-user counts multiplied by normalized rates (Google's GA4 benchmarking documentation). Use those comparisons for diagnosis, not as a substitute for your own commercial baseline.
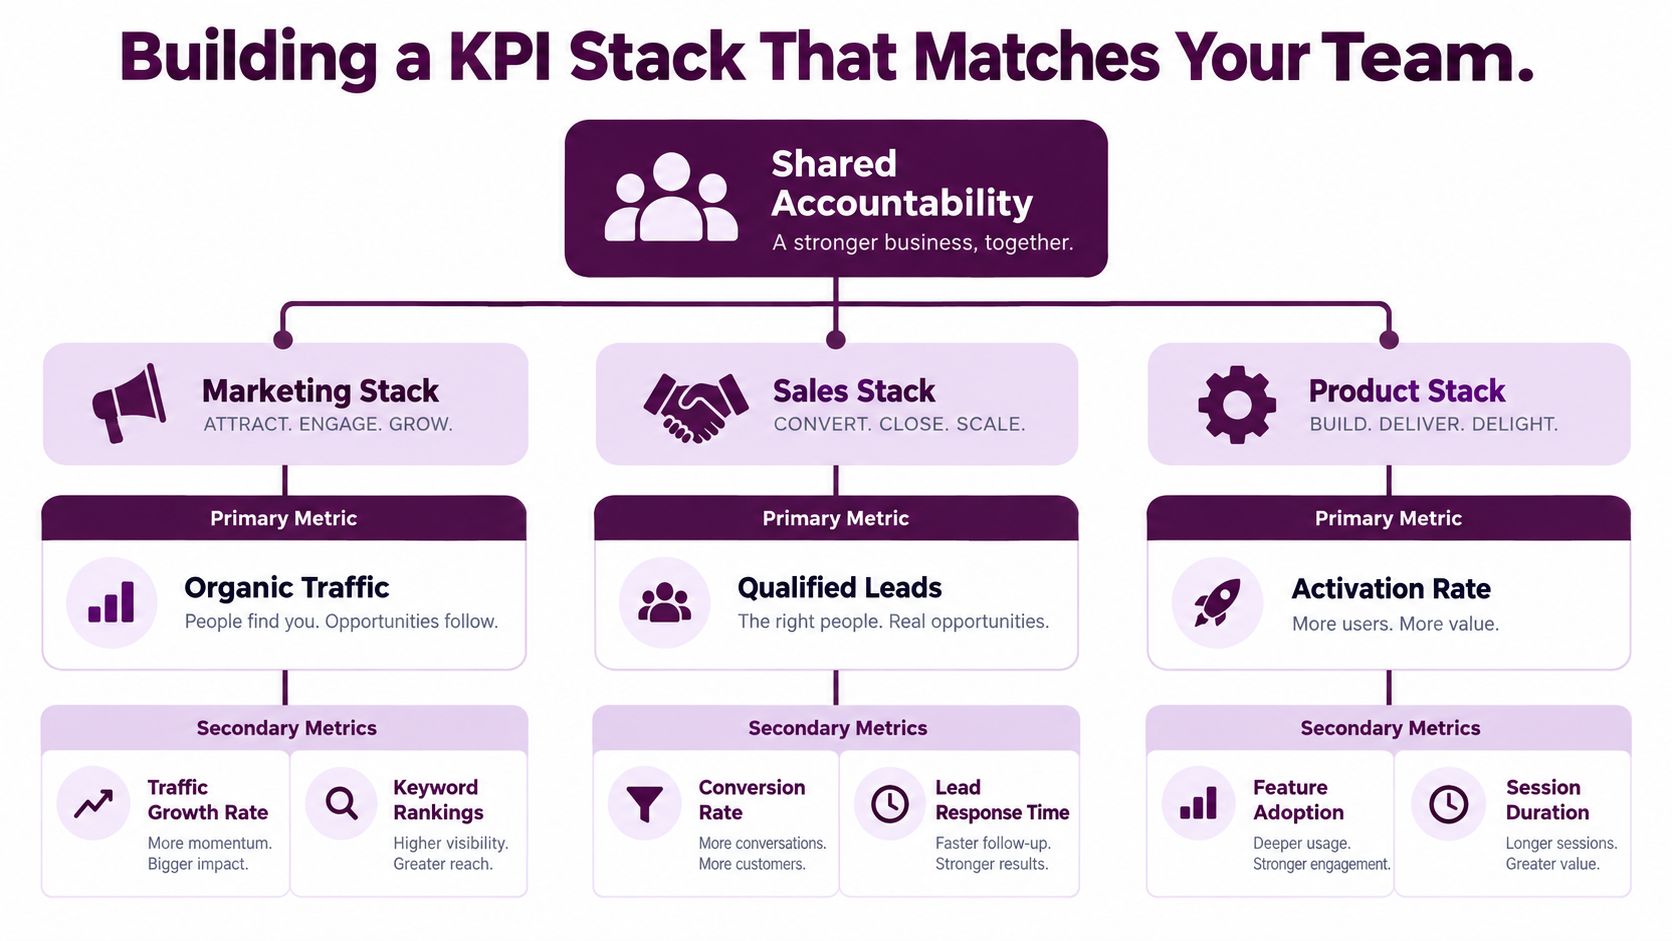
Each primary metric must be measurable in the team's own toolset and influenceable within its sprint cycle. If the SEO team can't change the CRM definition, don't make closed-won revenue its only weekly KPI. If leadership wants revenue accountability, connect the stack across systems without pretending every team owns the full funnel.
Tricky Anomalies and How to Diagnose Them Quickly
A sudden change deserves investigation, not an immediate explanation. Consider an organic traffic drop of 28%. The number is alarming, but it doesn't tell you whether rankings fell, tracking broke, a filter changed, or the comparison period contains a seasonal distortion.
Start with data integrity. Check whether the GA4 property, date range, channel filters, consent configuration, and tagging changed. Then compare the same landing pages in Search Console, inspect coverage and manual-action information, and segment GA4 by device, country, landing page, and source. If Search Console clicks are stable while GA4 organic sessions fall, investigate measurement and attribution before touching content.
A second story looks different. Sessions rise 15%, but form submissions stay flat. Don't celebrate the traffic increase or accuse the form immediately. Compare landing-page composition, source mix, device behavior, key-event firing, consent-related thresholds, and the relationship between engaged sessions and form starts.
Ask these questions before changing anything
Is the date range comparable? Check weekdays, campaign timing, holidays, and publishing cycles.
Did the property or filter change? Review configuration history and reporting views.
Did a tag stop firing? Test the event, not just the page.
Has audience composition shifted? Segment by source, device, geography, and landing page.
Is the movement outside normal variance? Compare multiple comparable periods before escalating.
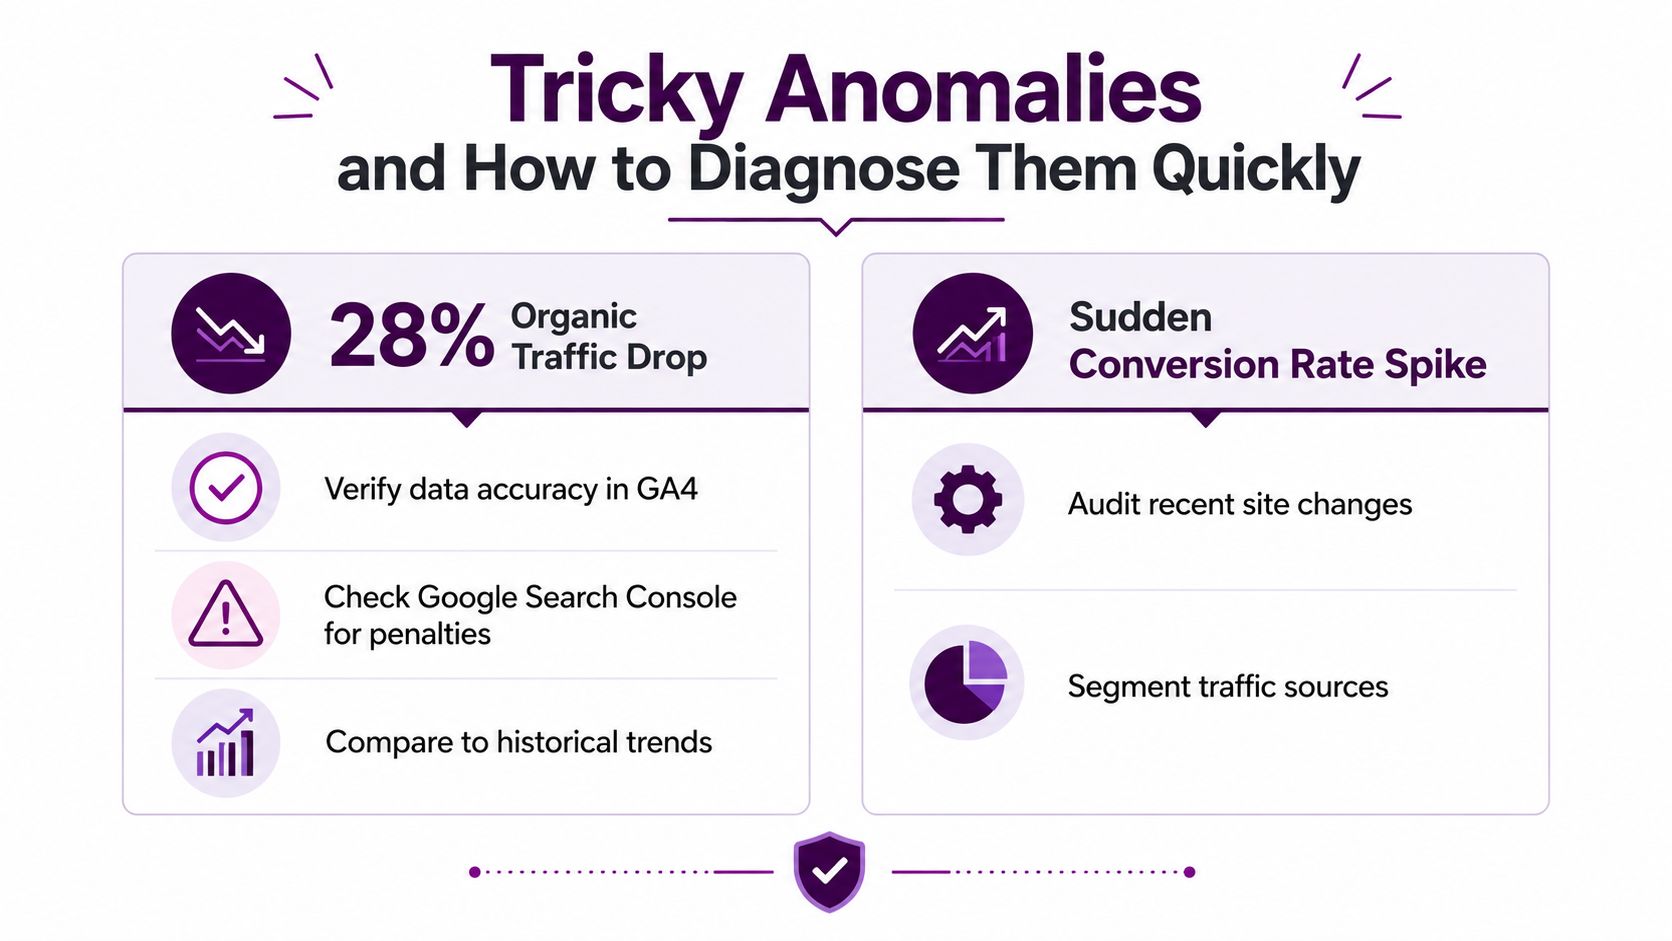
Escalate in order. Analytics or engineering owns tracking validation. SEO owns ranking and Search Console investigation. Paid media owns campaign and spend checks. Product or CRO owns page and funnel diagnosis. Leadership gets involved only after the team identifies whether the anomaly is a data problem, an audience problem, or a genuine performance problem.
Turning Metrics Into Prioritized Actions With Unified Tools
No single dashboard naturally connects ranking volatility, traffic quality, conversion rate, page speed, and CRM outcomes. The data usually lives across GA4, Search Console, a rank tracker, a performance tool, advertising platforms, and the CRM. Exporting each report into a weekly slide deck doesn't create analysis. It creates a delay between the signal and the fix.
A unified signal workflow needs four capabilities:
Cross-source correlation: Flag when ranking loss, organic clicks, engagement, and conversions move together.
Baseline-aware anomaly detection: Compare a metric with a relevant historical pattern instead of a static threshold.
Quantification: Translate a movement in traffic quality or conversion rate into its likely commercial impact.
Prioritization: Score fixes by effort, affected pages, urgency, and expected business value.
The objective isn't to centralize every available number. It's to compress the path from “something changed” to “this person should do this next.” A weekly review should show the metric that moved, the threshold or baseline it breached, the likely explanation, and the next action that can confirm or correct it.
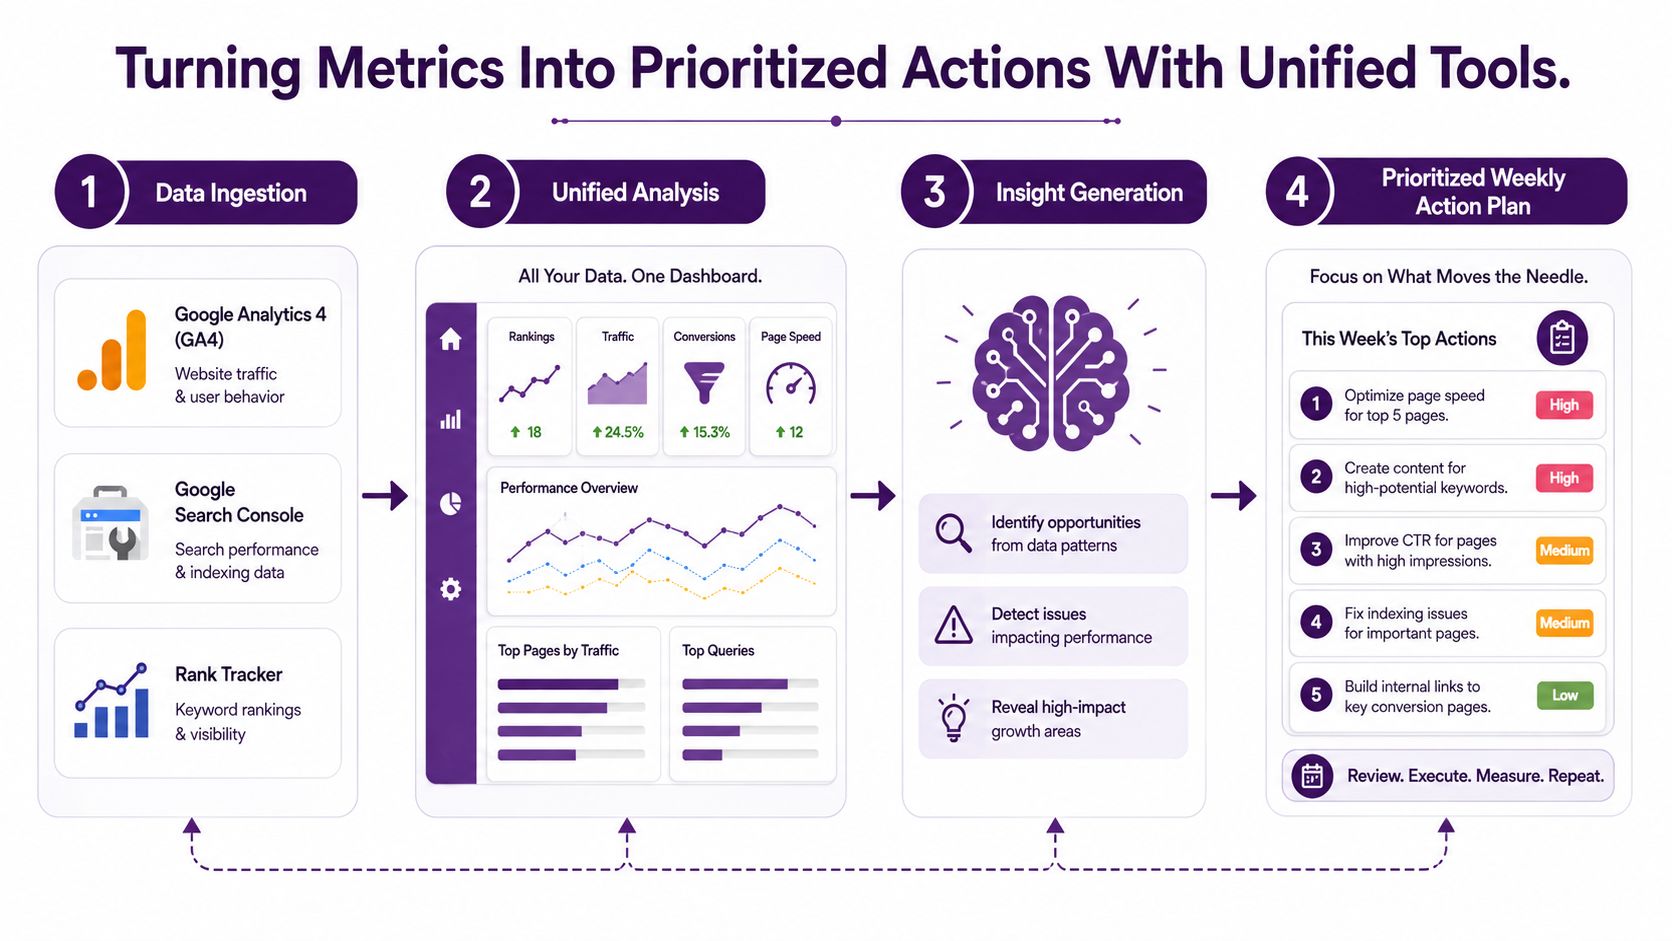
Keyword Kick is one example of this model. It connects GA4 traffic data with Search Console, rank tracking, backlinks, and technical SEO signals in a shared workspace, then supports questions such as why traffic changed or which pages deserve attention first. That workflow doesn't eliminate analyst judgment. It gives the analyst a connected evidence trail instead of a stack of unrelated dashboards.
The right outcome is fewer dashboards and faster decisions. If a platform adds another layer of charts without assigning ownership and next actions, it has increased reporting volume, not analytical capability.
Keyword Kick connects GA4, Search Console, rankings, backlinks, and technical SEO signals so teams can turn website analytics metrics into prioritized SEO actions. Visit Keyword Kick to investigate traffic changes, identify pages to optimize first, and organize the next step around evidence rather than dashboard noise.