
Web analytics is the practice of collecting, measuring, and interpreting data about how people use a website. In practical terms, it measures what visitors do on your site so you can make better marketing and product decisions.
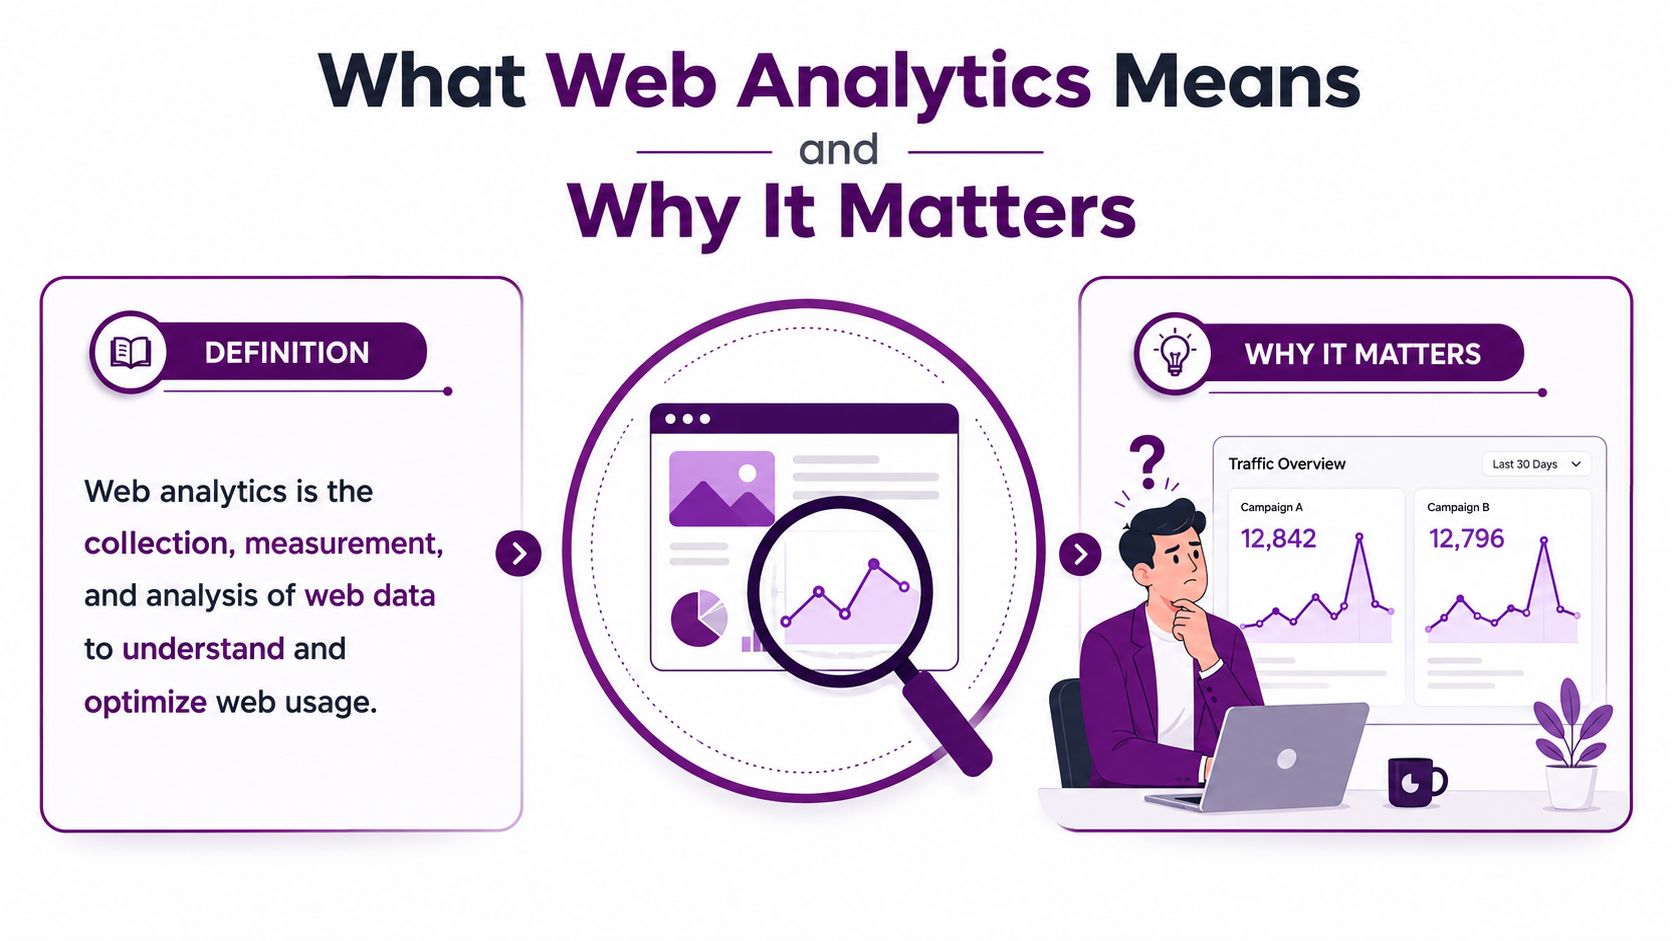
You may be looking at two traffic spikes from different campaigns, yet still have no clear answer to the question that matters: which campaign produced signups, qualified leads, or sales? A traffic chart can show that something changed. Web analytics helps you investigate what changed, who was affected, and what your team should do next.
The discipline has grown from simple page-hit counting into a measurement system for traffic sources, behavior, conversions, technical signals, and customer journeys. Analog, the first widely used web analytics tool, launched in 1995 and analyzed server logs to show which pages people visited. Google launched Google Analytics in November 2005 after acquiring Urchin Software, helping make advanced website measurement broadly accessible. One industry account says 100,000 accounts were created during its first week (Web Design Museum's history of Google Analytics).
This guide follows the complete path from data capture to business action. You'll learn what the main metrics mean, how browser and server tracking differ, how SEO and marketing teams use reports, and why privacy compliance depends on implementation choices rather than the analytics brand you select. For broader context on connecting website measurement to business decisions, this framework for marketing analytics offers a useful companion perspective.
What Web Analytics Means and Why It Matters
Web analytics is the collection, measurement, analysis, and interpretation of website data to understand and improve how people use a site. The definition sounds straightforward, but the work involves more than installing a tracking script. A useful analytics practice connects visitor behavior to a decision, such as improving a landing page, reallocating campaign effort, or removing friction from checkout.
From visits to decisions
A report might tell you that organic sessions increased while paid traffic declined. That observation isn't yet an insight. You need to examine landing pages, engagement, conversion events, campaign details, and revenue before deciding whether the change reflects stronger SEO performance, weaker advertising, a tracking problem, or a shift in audience intent.
The business value comes from asking better questions:
Acquisition: Which sources bring people who take meaningful actions?
Experience: Where do visitors become confused, delayed, or disengaged?
Content: Which pages support signups, purchases, or other defined outcomes?
Product: Which journeys help users complete important tasks?
Ad budgets are tighter, privacy expectations are stricter, and teams often work across separate marketing, product, and sales systems. Gut feeling can still generate useful hypotheses, but it can't reliably explain performance on its own. Analytics gives teams a shared evidence layer, provided they understand what the data includes and where it may be incomplete.
What the discipline measures
Modern web analytics can connect a visitor's entry source with actions such as clicks, scrolls, form submissions, purchases, and return visits. It can also help teams compare audience segments, analyze conversion paths, and identify pages where a journey loses momentum.
The important distinction is between measurement and interpretation. A number doesn't explain motivation, intent, or causality by itself. It gives you a signal to investigate, test, and combine with qualitative evidence such as user research, support conversations, or sales feedback.
By the end of a sound analytics setup, you should know which numbers deserve attention, how those numbers were produced, and which actions are defensible under your privacy obligations.
How Web Analytics Works Behind the Scenes
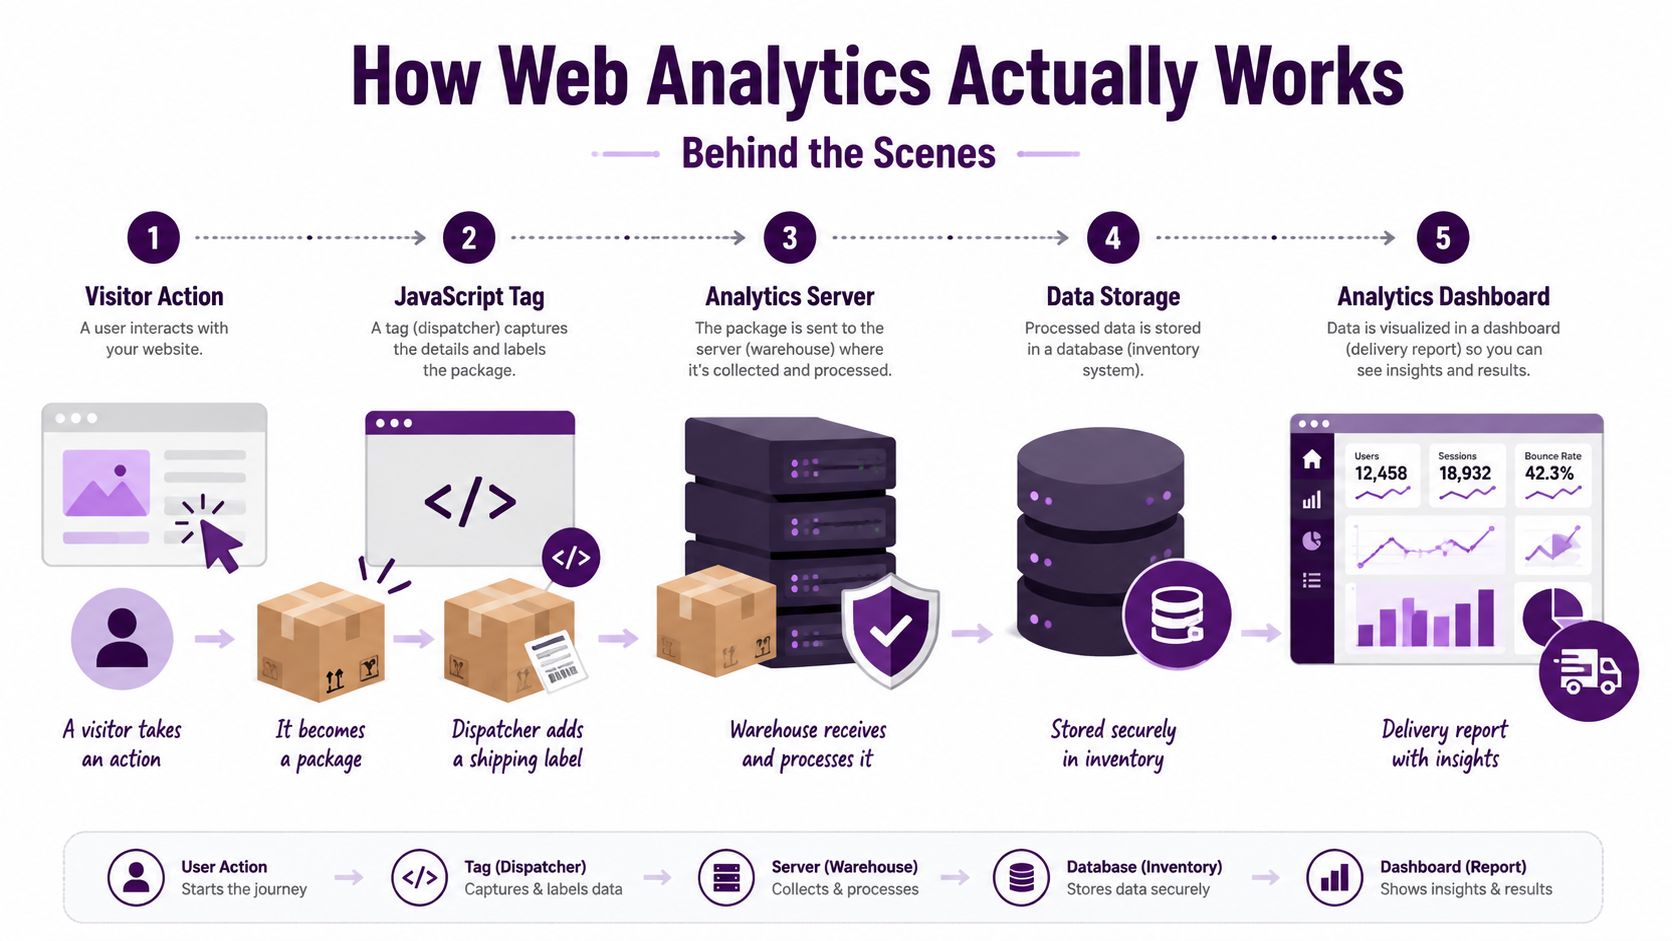
A website analytics system operates like a delivery network. Each meaningful visitor action is a package: a page view, button click, search, scroll, or purchase. The package needs enough context to reach the correct reporting destination and remain useful after processing.
The browser is where many packages begin. A JavaScript tag observes a permitted interaction and prepares an event payload. A tag manager can dispatch that payload by deciding which tags run, under which conditions, and which parameters belong to the event. The collection endpoint receives it, while the processing system sorts and transforms it.
The capture to report pipeline
A typical journey follows five stages:
An action occurs. A visitor opens a product page, selects a plan, or submits a form.
A tag creates an event. The browser or application records the interaction with a timestamp, identifier, page context, and relevant parameters.
A collection service receives it. The analytics platform accepts the event through a collection endpoint.
Processing standardizes it. The platform validates, groups, filters, and transforms raw events into dimensions and metrics.
Reports expose patterns. Dashboards and explorations turn processed records into acquisition reports, funnels, paths, cohorts, and conversion analyses.
This order matters because reporting cannot repair missing or duplicated inputs. If a purchase event fires twice, revenue and conversion results can become misleading. If campaign parameters disappear, channel comparisons lose context. If a form submission sends no event, the dashboard may show zero conversions even when customers completed the form.
Privacy choices also shape the pipeline. Analytics should capture only permitted signals, with identifiers and parameters limited to what the stated purpose requires. A technically complete dataset is not automatically a defensible one.
Why events become sessions and reports
Modern analytics stores interactions as events, then organizes them into sessions, conversion paths, cohorts, and retention views. The capture, storage, transform, and activate model described by Valiotti clarifies why collection and business action belong to one connected system.
The destination might be Google Analytics 4, Matomo, or a warehouse such as BigQuery. The architecture varies, but the logic remains similar: capture permitted signals, process them consistently, store them accessibly, and present them in a form someone can act on.
Practical rule: Treat every report as the final output of a pipeline. When a number looks wrong, inspect the event and processing rules before changing your interpretation.
Core Metrics and KPIs You Should Track First
A metric is any measurable value. A key performance indicator, or KPI, is a metric deliberately connected to an important business outcome. Pageviews may be useful for understanding content reach, but a newsletter signup, qualified lead, completed purchase, or retained user may be a stronger KPI for a team with a specific commercial objective.
Start by organizing measurement into four groups.
The four metric families
Traffic metrics describe volume and activity. Users represent people or user identifiers as the platform defines them. Sessions represent visits or periods of activity. Pageviews count page loads. One person can create multiple sessions, and one session can contain multiple pageviews, so these values answer different questions.
Acquisition metrics explain where activity came from. A channel is a broad grouping such as organic search, paid search, email, or referral. Source identifies the originating platform or site, medium describes the traffic type, and campaign names a specific marketing initiative. Misclassified acquisition data can make a successful campaign look weak or cause teams to fund traffic that doesn't convert.
Engagement metrics describe attention and interaction. GA4-style measurement defines an engaged session as one lasting more than 10 seconds, containing at least one key event, or including two or more pageviews (Metabase's explanation of bounce rate). In this model, bounce rate is the inverse of engagement rate, so it isn't the share of sessions that viewed one page.
Conversion metrics connect activity to outcomes. Events record actions, while selected events become key events or conversions for reporting. Conversion rate compares conversions with an appropriate denominator, but the denominator must be chosen carefully. A purchase rate, lead rate, and signup rate may all be valid, yet they represent different stages of value. Assisted conversions can show that a channel helped a journey without receiving the final interaction.
Category | Metric | What It Measures | When to Care |
|---|---|---|---|
Traffic | Users | Distinct audience activity as defined by the platform | When assessing reach or audience changes |
Traffic | Sessions | Visits or activity periods | When comparing site activity by channel |
Acquisition | Source and medium | Origin and type of traffic | When evaluating campaign quality |
Engagement | Engagement rate | Share of sessions meeting the engagement definition | When diagnosing relevance and landing-page experience |
Conversion | Conversion rate | Share of relevant visitors or sessions completing an outcome | When judging funnel efficiency |
Conversion | Revenue | Commercial value attributed to tracked transactions | When traffic volume isn't enough to guide investment |
Don't optimize bounce rate in isolation. A visitor may find the answer on a single page and leave satisfied, while another may open several pages without progressing toward a meaningful outcome. For a practical explanation of interpretation, see SWAT Marketing Solutions on bounce rate.
A sensible first priority list
For many small and mid-size teams, the first KPIs to define are:
A primary business conversion, such as a purchase or qualified lead.
A supporting conversion, such as a signup, demo request, or activation action.
Conversion rate by source, landing page, and device context.
Revenue or lead quality, where the business can connect those outcomes reliably.
Engagement indicators, used to diagnose rather than replace business results.
Choose fewer KPIs than your reporting tool can display. A crowded dashboard creates the appearance of control while making prioritization harder.
Data Collection Methods From Page Tags to Server-Side
The collection method determines which signals your analytics system can receive, how much control your team has over them, and where data quality can break down. The common approaches aren't interchangeable, even when they send similarly named events.
Three approaches with different tradeoffs
Client-side page tags run in the visitor's browser. A JavaScript snippet loads, reads permitted page context, and sends events to an analytics platform. This is often the fastest way to prototype tracking, but browser extensions, ad blockers, privacy features, slow connections, consent settings, and script failures can prevent collection. The method also places more responsibility on the page for data redaction and tag sequencing.
GA4's event model treats interactions as events with parameters rather than forcing every action into an old pageview-and-session framework. A product view might include item details, while a form submission might include form context and page location. The flexibility supports deeper product and content analysis, but it also creates governance work. Teams must define event names, parameter rules, ownership, and conversion eligibility before reports become consistent.
Server-side tracking moves collection and forwarding logic to a server or tagging server controlled by the organization. The browser may still initiate a signal, but the server can validate, filter, enrich, or reject data before sending it onward. This can improve data hygiene and resilience, but it requires technical ownership, documented policies, and careful privacy review. Server-side collection doesn't make an unlawful data practice lawful by itself.
Dimension | Client-Side Tags | GA4 Event Model | Server-Side Tracking |
|---|---|---|---|
Main location | Visitor browser | Usually browser, using event-based schema | Organization or tagging server |
Strength | Quick deployment | Flexible interaction model | Greater control before forwarding |
Main risk | Blocked or delayed scripts | Inconsistent event governance | Added architecture and maintenance |
Best starting use | Basic website measurement | Product and journey depth | Controlled, resilient data flows |
A practical decision rule is simple: use client-side tags for quick validation, adopt a clear GA4 event model for product depth, and consider server-side processing when resilience, filtering, and data control justify the additional complexity. Teams explaining measurement to nontechnical stakeholders can also use this guide to explaining SEO metrics to connect collection choices with business questions.
Real Use Cases for SEO and Marketing Teams
Web analytics becomes useful when a named person can use it to answer a specific operational question. The report matters less than the decision it supports.
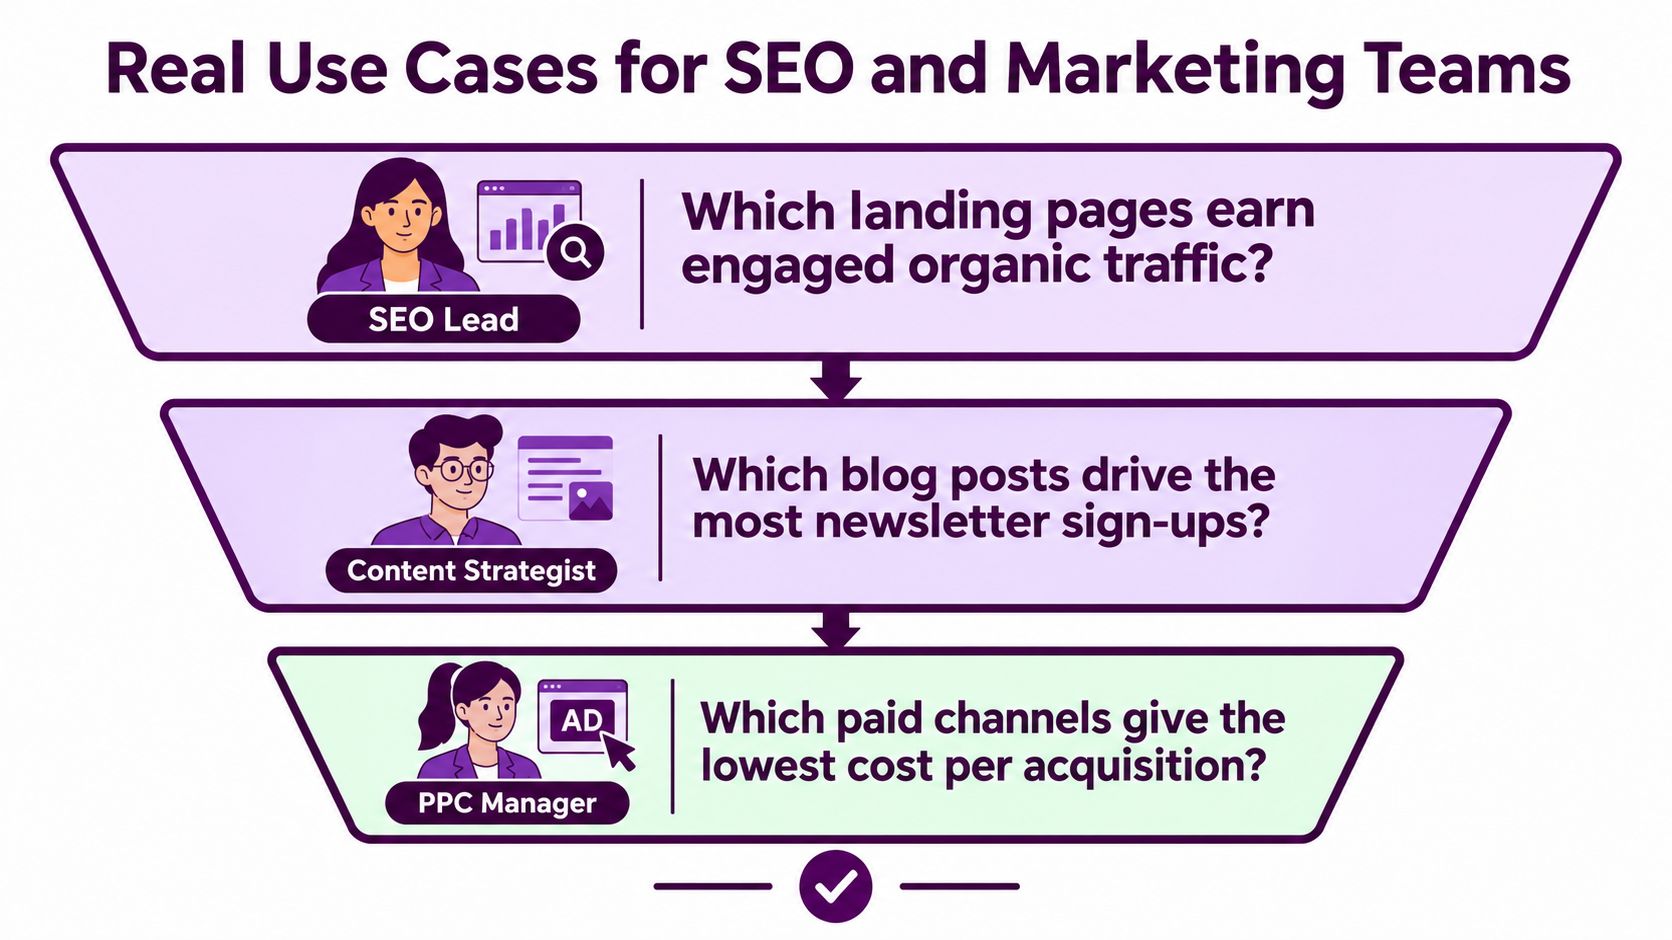
Three people, three decisions
An SEO lead might open an acquisition report or exploration filtered to organic search landing pages. They compare engaged sessions, conversion rate, landing-page intent, and the actions visitors take after arriving. A page with strong visibility but weak engagement may need a clearer opening, better search-intent alignment, or improved internal navigation. The next action isn't automatically “publish more content.” It might be rewriting the page that already attracts relevant users.
A content strategist may examine scroll activity, engagement time, outbound clicks, and newsletter signups by article. These signals can reveal whether an article attracts attention but fails to move readers toward the next useful step. The strategist can then revise calls to action, strengthen content structure, or develop adjacent topics based on demonstrated audience interest. Time and scroll depth are diagnostic signals, not proof that a page created business value.
An e-commerce manager uses a funnel exploration to inspect product views, cart actions, checkout starts, payment attempts, and completed purchases. If the largest drop appears at payment, the team can test payment messaging, error handling, form design, or trust information. Analytics identifies the location of friction. Session recordings, support feedback, and controlled experiments help explain the cause.
One shared view of performance
These teams should work from a dashboard that connects organic traffic, paid acquisition, landing-page engagement, conversions, and revenue. A shared view prevents the SEO team from celebrating visits while the commercial team sees no pipeline, and it stops paid media from claiming credit for conversions that began with another channel.
Useful dashboard dimensions include:
Channel and source: How visitors arrived.
Landing page: Where the journey began.
Engagement: Whether visitors showed meaningful attention.
Funnel stage: Where progress stopped.
Outcome: Which actions and revenue were recorded.
For a practical way to connect SEO activity with outcomes, consult this guide to measuring SEO performance. The strongest dashboard doesn't answer every possible question. It helps the right people make the next decision without exporting separate spreadsheets.
Privacy, Compliance, and the GA4 Consent Trap
Switching to GA4 doesn't automatically make analytics privacy-safe. Compliance depends on the signals you collect, the settings you choose, the consent experience you operate, the contracts you maintain, and the legal basis that applies to your audience and jurisdiction.
GA4 uses an event-based model and includes privacy-oriented controls, but those features don't give teams permission to collect personal data casually. The HHS privacy impact assessment for Google Analytics 4 emphasizes the need to consider event data, cookie-less measurement, privacy protections, consent, and restrictions on personal information.
What teams need to decide
Before implementation, document:
Consent timing: Whether non-essential measurement tags wait until the visitor provides the required permission.
Consent signals: Whether Consent Mode and its current configuration accurately reflect the visitor's choices.
Data minimization: Whether URLs, form fields, event parameters, and page content could expose personal information.
Retention: How long event and user-level data remain available in the platform.
Contracts and transfers: Whether the organization has the required data processing agreements and a defensible approach to international data transfers.
Runtime behavior: Whether tags behave as documented before and after consent.
The distinction between necessary and behavioral measurement matters. A site may be able to support strictly necessary operations without consent in some contexts, while behavioral or marketing analytics often requires permission. The legal answer depends on the applicable rules and the organization's role, so analytics teams should involve counsel rather than turning a vendor setting into a compliance conclusion.
A useful cookie policy resource can help teams communicate what technologies do, but the policy must match what the website sends. A polished banner cannot correct a tag that fires too early or an event that contains a visitor's email address.
Defensible default: Collect the least data needed, block non-essential tags until the required consent exists, redact personal information at the source, document retention and contracts, and test the runtime behavior regularly.
Implementation Checklist and Common Pitfalls to Avoid
A reliable analytics implementation starts with decisions, not code. Write down the business questions first, then define the events and reports needed to answer them.
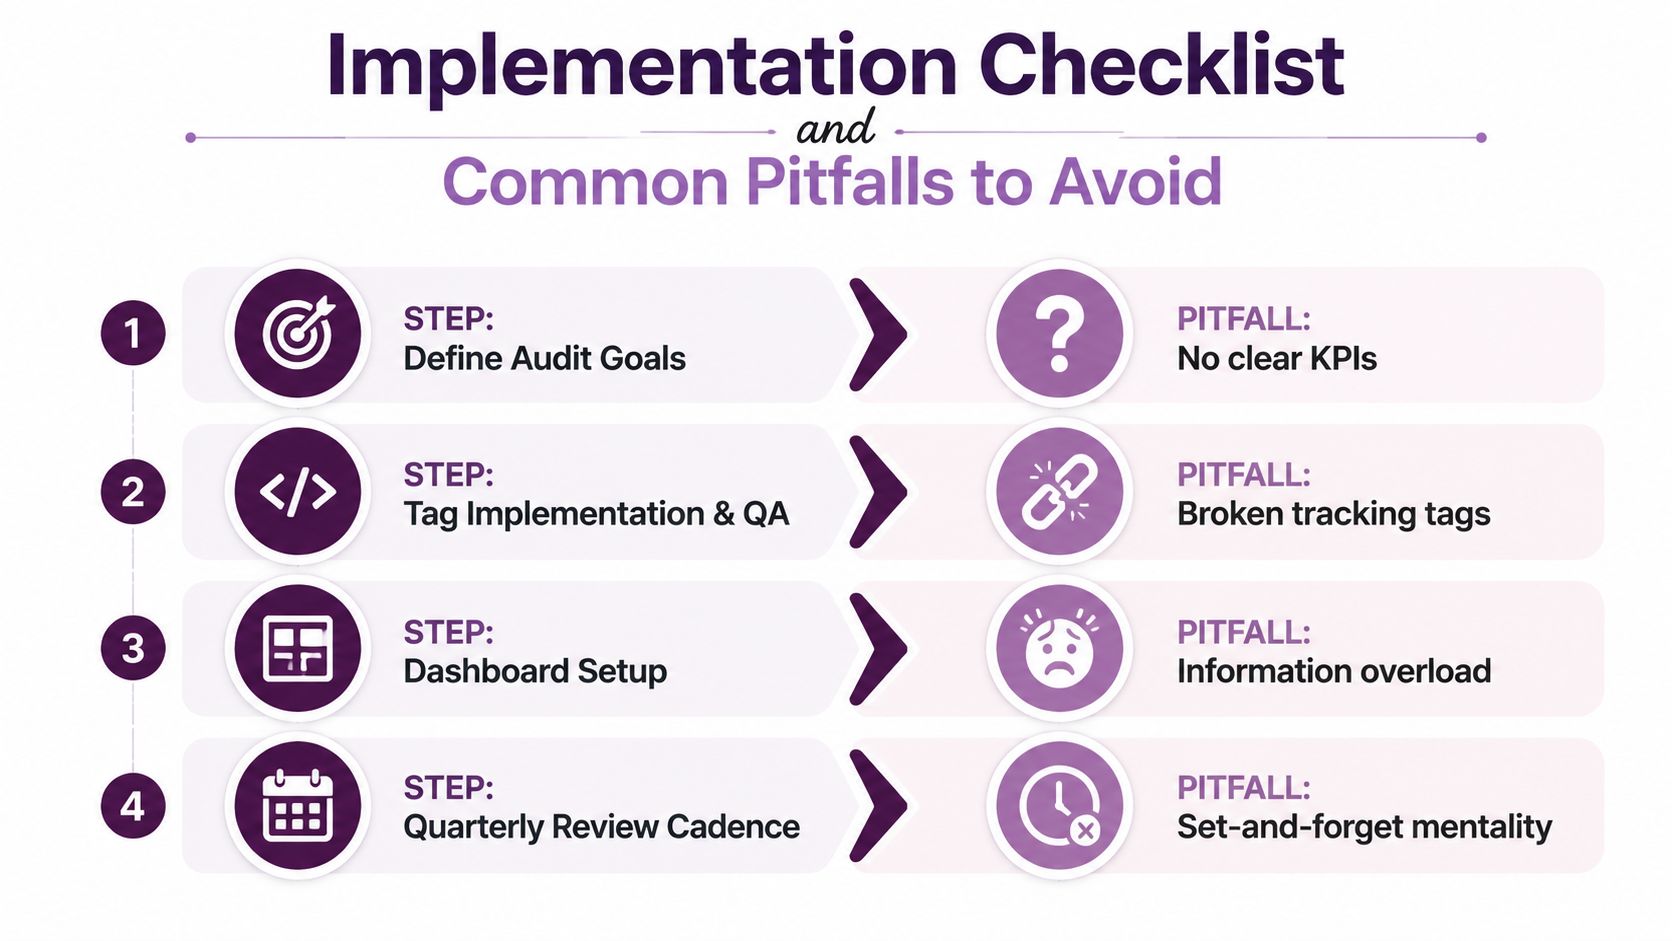
Build the system in a deliberate order
Define audit goals. Choose the primary outcome, supporting actions, important audiences, and decision owners. The common failure is measuring everything before agreeing on KPIs.
Create the tracking plan. Name events, parameters, conversions, campaign conventions, and data exclusions. Avoid duplicate pageview and interaction triggers, which can inflate reports.
Implement and test tags. Use a staging environment, browser debugging, consent-state checks, and transaction validation. Test successful, failed, repeated, and interrupted journeys.
Build focused dashboards. Give each team a small set of views tied to decisions. An unfiltered exploration snapshot can mislead if users, dates, filters, or attribution settings change.
Review data quality. Check sudden source shifts, unexplained conversion changes, internal traffic, referral spam, and bot-like activity. Don't assume every recorded interaction represents a potential customer.
Create a recurring operating rhythm. Review tracking after site releases, campaign launches, consent changes, and major product updates. Analytics isn't a one-time installation.
Turn reporting into an optimization loop
Suppose a weekly report shows that a key landing page receives organic visits but produces few meaningful actions. The team forms a hypothesis: visitors don't see a relevant next step. It updates the page, records the change, and compares the same defined outcome in the next review cycle.
The process isn't “watch the dashboard and hope.” It is observation, hypothesis, change, measurement, and decision. If the outcome doesn't improve, the team learns that the hypothesis needs revision. If it does improve, the team still checks whether traffic quality, seasonality, tracking changes, or another factor could explain the movement.
Cookieless measurement, consent-mode refinements, server-side architectures, and stronger governance will continue to shape analytics practice. Teams that treat their measurement system as a living product, with owners, tests, documentation, and review, will make better decisions than teams that install a tool and stop maintaining it.
The useful question isn't “Do we have analytics?” It's “Can we trust this signal enough to act on it, and can we defend how we collected it?”
Keyword Kick connects Google Analytics 4, Google Search Console, rankings, backlinks, and technical SEO signals so teams can investigate performance changes in one workspace. Visit Keyword Kick to turn web analytics and search data into prioritized actions for your next optimization cycle.