Introduction
Core Web Vitals have been part of Google's ranking algorithm since 2021. Yet most SEO audits still treat them as a checkbox — something to glance at and move on from.
That's a mistake.
In 2026, page experience signals are more integrated into rankings than ever. A slow, jittery page doesn't just frustrate users — it costs you positions. And unlike content quality or backlinks, CWV issues are often fixable in hours, not weeks.
This guide explains what each Core Web Vital actually measures, what "good" looks like, and — most importantly — what to do when your scores are poor.
No developer jargon. Just clear explanations and actionable fixes.
What Are Core Web Vitals?
Core Web Vitals (CWV) are a set of real-world performance metrics defined by Google to measure how users experience a page — not just how fast it technically loads, but how it feels to use.
There are three metrics:
Metric | Measures | Good Score |
|---|---|---|
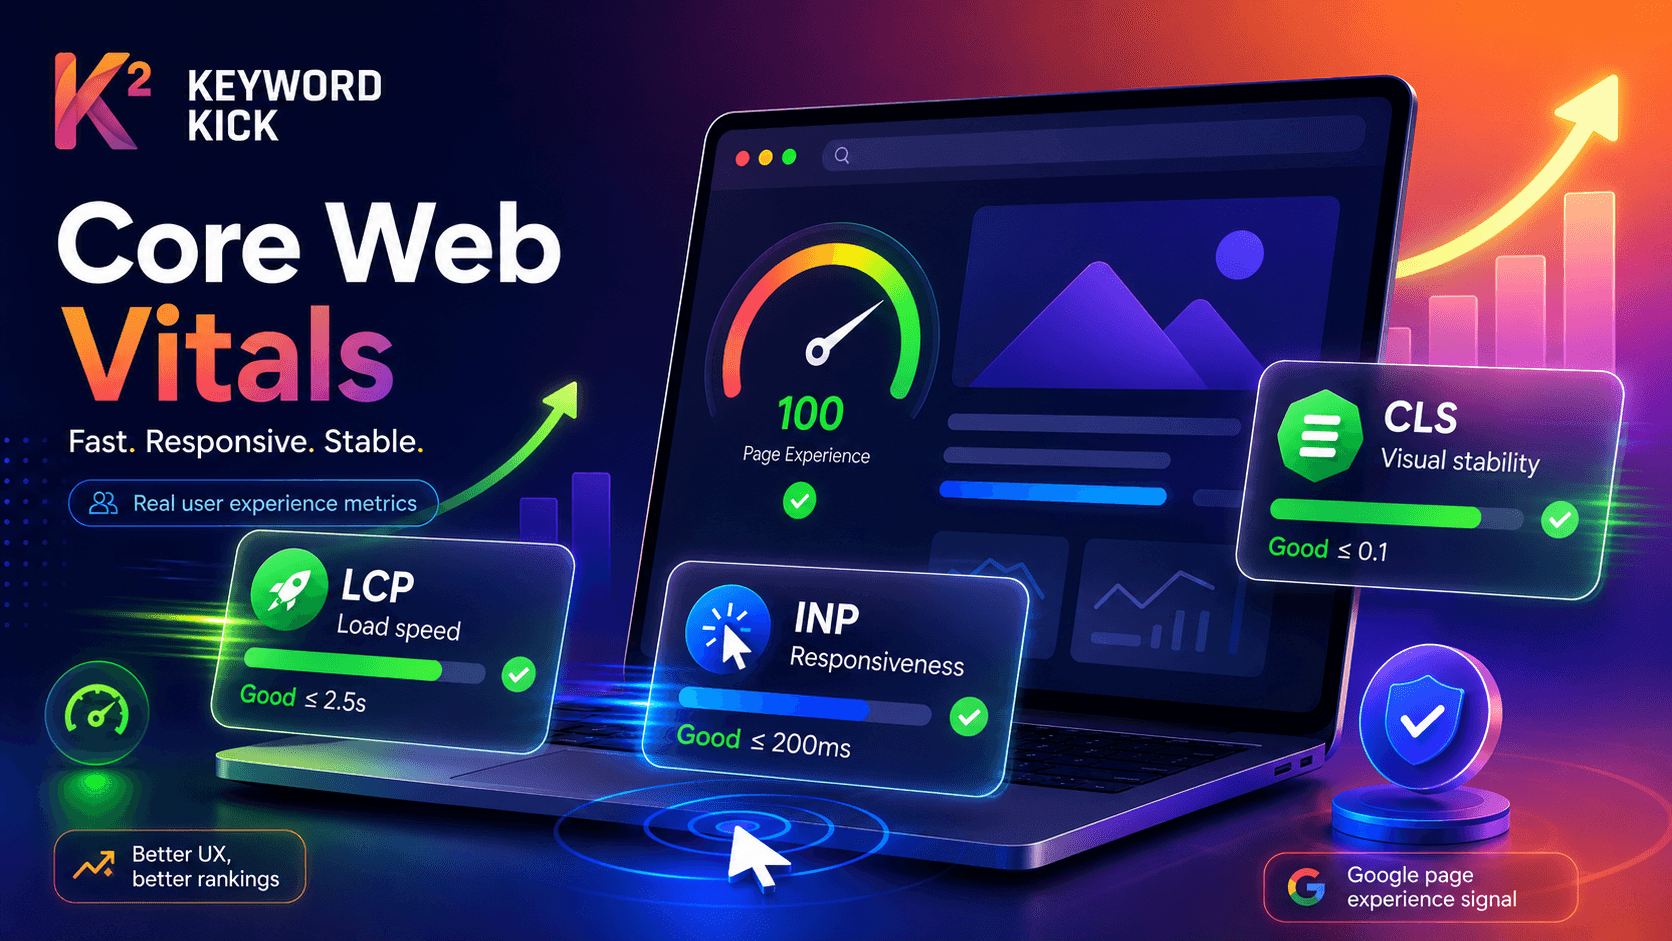
LCP – Largest Contentful Paint | Loading speed of the main content | ≤ 2.5 seconds |
INP – Interaction to Next Paint | Responsiveness to user input | ≤ 200 milliseconds |
CLS – Cumulative Layout Shift | Visual stability (do things jump around?) | ≤ 0.1 |
Google collects these from real Chrome users via the Chrome User Experience Report (CrUX) — meaning your scores reflect actual visitor experience, not just lab conditions.
Note on INP: In March 2024, Google replaced First Input Delay (FID) with Interaction to Next Paint (INP) as the official responsiveness metric. If you're still seeing FID in older reports, it's no longer a ranking factor. INP is what matters now.
LCP — Largest Contentful Paint
What It Measures
LCP tracks how long it takes for the largest visible element on the page to load. That's typically:
A hero image or banner
A large heading
A video thumbnail
It's a proxy for "how fast does the page feel useful?" — because the largest element is usually what users are waiting for.
Score Benchmarks
Score | Rating |
|---|---|
≤ 2.5s | ✅ Good |
2.5s – 4.0s | 🟡 Needs Improvement |
> 4.0s | 🔴 Poor |
What Causes a Poor LCP Score
Large, uncompressed images — the single most common cause
Render-blocking resources — JavaScript or CSS that delays the page from rendering
Slow server response time (TTFB) — if the server is slow, everything else is slow
No lazy loading strategy — loading off-screen images eagerly
How to Fix It
Compress and convert images to WebP — WebP is typically 25–35% smaller than JPEG at equivalent quality
Add
fetchpriority="high"to your hero image — tells the browser to prioritise loading itEliminate render-blocking resources — defer non-critical JavaScript, inline critical CSS
Use a CDN — reduces server response time by serving assets from locations closer to the user
Enable browser caching — repeat visitors load the page from cache, not from scratch
INP — Interaction to Next Paint
What It Measures
INP measures how quickly the page responds after a user interacts with it — clicking a button, opening a menu, typing in a search field. It captures the worst interaction latency during the entire page visit.
This is the metric most site owners don't think about — but users feel it constantly. A page that loads fast but freezes for half a second every time you click something has a poor INP score.
Score Benchmarks
Score | Rating |
|---|---|
≤ 200ms | ✅ Good |
200ms – 500ms | 🟡 Needs Improvement |
> 500ms | 🔴 Poor |
What Causes a Poor INP Score
Heavy JavaScript execution — the browser is busy running scripts when the user clicks
Long tasks blocking the main thread — any task over 50ms delays the browser's ability to respond
Third-party scripts — analytics, chat widgets, ad scripts, and tag managers are common culprits
Excessive DOM size — pages with thousands of HTML elements are slower to update
How to Fix It
Audit and reduce third-party scripts — use your browser's Performance panel to see which scripts take longest
Break up long tasks — split heavy JavaScript into smaller chunks using
setTimeoutorscheduler.postTask()Defer non-critical JavaScript — anything that doesn't need to run on page load, shouldn't
Reduce DOM complexity — aim for under 1,500 total DOM nodes
INP fixes often require a developer. But identifying which scripts cause the problem is something you can do yourself — and Keyword Kick flags INP issues at the page level so you know exactly where to look.
CLS — Cumulative Layout Shift
What It Measures
CLS measures visual stability — how much the page layout shifts unexpectedly while loading. You've experienced bad CLS when you're about to click a button and an ad loads above it, pushing it down at the last second.
Layout shifts are disorienting, frustrating, and directly measured by Google.
Score Benchmarks
Score | Rating |
|---|---|
≤ 0.1 | ✅ Good |
0.1 – 0.25 | 🟡 Needs Improvement |
> 0.25 | 🔴 Poor |
What Causes a Poor CLS Score
Images without explicit width/height dimensions — the browser doesn't know how much space to reserve
Ads, embeds, and iframes without reserved space — they load late and push content down
Web fonts causing FOUT (Flash of Unstyled Text) — text reflows when the custom font loads
Dynamically injected content — banners, cookie notices, and popups that appear above existing content
How to Fix It
Always specify
widthandheighton images — even with responsive CSS, the browser uses the aspect ratio to pre-reserve spaceReserve space for ads and embeds — set a fixed
min-heighton ad containers before they loadUse
font-display: optionalorfont-display: swap— reduces text reflow from font loadingAvoid inserting content above existing content — if you need a banner or cookie notice, position it at the bottom or as an overlay
How Core Web Vitals Affect Your Rankings
Google uses CWV as a tiebreaker at the page level — not a replacement for relevance and authority, but a differentiator when two pages are otherwise comparable.
That means:
Fixing CWV won't rescue a page with irrelevant content
But between two pages of equal quality, the faster, more stable one ranks higher
On competitive queries where page 1 is densely packed, CWV can be the margin that separates position 3 from position 6
There's also an indirect effect: better page experience → lower bounce rate → longer dwell time → stronger engagement signals. These compound over time.
Field Data vs. Lab Data — Which One Matters for Rankings?
You'll encounter two types of CWV data:
Type | Source | Used for Rankings? |
|---|---|---|
Field data (real-user data) | Chrome UX Report (CrUX) | ✅ Yes |
Lab data (simulated) | Lighthouse, PageSpeed Insights | ❌ No (diagnostic only) |
Field data is what Google uses. Lab data is useful for diagnosing issues and testing fixes, but your actual ranking impact comes from real user experience.
Caveat: if your site doesn't have enough Chrome traffic to generate field data (typically new or low-traffic pages), Google falls back to lab data. For most pages on established sites, field data applies.
How to Check Your Core Web Vitals
Option 1 — Google Search Console
GSC's Core Web Vitals report (under Experience) shows field data grouped by "Good", "Needs Improvement", and "Poor" at the URL group level. It's the authoritative source for what Google actually sees.
Limitation: It groups similar URLs together and doesn't show individual page scores.
Option 2 — Google PageSpeed Insights
Paste any URL at pagespeed.web.dev to see both field data (if available) and lab data side by side. Good for diagnosing individual pages.
Option 3 — Keyword Kick Site Audit
Keyword Kick's Site Audit includes a Core Web Vitals Assessment that surfaces CWV issues across your entire site — not just one URL at a time. It shows:
Which pages have Poor or Needs Improvement scores
Which specific metric is failing (LCP, INP, or CLS)
Prioritised fix recommendations so you tackle the highest-impact issues first
This is the fastest way to audit CWV across a site with hundreds of pages without running PageSpeed Insights manually on each one.
A Practical Priority Order for Fixes
If your CWV scores need work, tackle them in this order:
1. Fix CLS first — usually the quickest wins (add image dimensions, reserve ad space). Low developer effort, high impact.
2. Fix LCP next — image compression and CDN setup are achievable without deep technical knowledge. Render-blocking scripts may need developer help.
3. Fix INP last — typically requires JavaScript profiling and developer involvement, but is only critical if your site has heavy interactivity (filtering, search, complex forms).
CWV Quick-Reference Summary
Metric | Measures | Good | Poor | Top Fix |
|---|---|---|---|---|
LCP | Largest element load time | ≤ 2.5s | > 4.0s | Compress images, use CDN |
INP | Response to user interaction | ≤ 200ms | > 500ms | Reduce JS, defer scripts |
CLS | Layout stability | ≤ 0.1 | > 0.25 | Add image dimensions, reserve ad space |