Teams often don't have a data shortage. They have a meaning shortage.
You open Google Search Console and see impressions, clicks, queries, and page trends. You open GA4 and see sessions, engagement, conversions, and event paths. Then someone asks a simple question: “Is SEO working?” That's where weak reporting falls apart. A pile of metrics isn't an answer.
If you want to understand how to measure SEO performance, stop treating SEO like a ranking report and start treating it like a funnel. The job isn't to prove that pages moved. The job is to show how search creates awareness, moves buyers closer to action, and contributes to leads, sales, or revenue. That shift changes everything from the KPIs you track to the way you investigate drops.
Defining SEO Goals That Actually Matter
A common first mistake is opening tools before defining success. That's backwards. SEO measurement starts with business goals, then works down into page types, user intent, and only then into metrics.
A blog post designed to capture early awareness should not be judged the same way as a pricing page or a checkout step. If you measure every page by the same number, usually organic traffic, you flatten the funnel and hide what SEO is achieving.
Stop Measuring All Organic Traffic as One Bucket
A major reporting gap is the failure to separate SEO performance by funnel stage. According to a Reddit discussion on quantitative SEO agency measurement, 78% of SEO performance guides still treat organic traffic as a single metric, which leads to misaligned KPIs and undervalued content impact (Reddit discussion on funnel-stage SEO measurement).
That problem shows up everywhere:
TOFU content gets dismissed because it doesn't convert immediately.
MOFU pages get overlooked because they don't drive the most sessions.
BOFU pages get under-optimized because reporting is focused on traffic, not revenue movement.
Practical rule: Every important URL should have a job. If you can't define the page's job, you can't measure its performance correctly.
Use the Funnel to Set Real KPIs
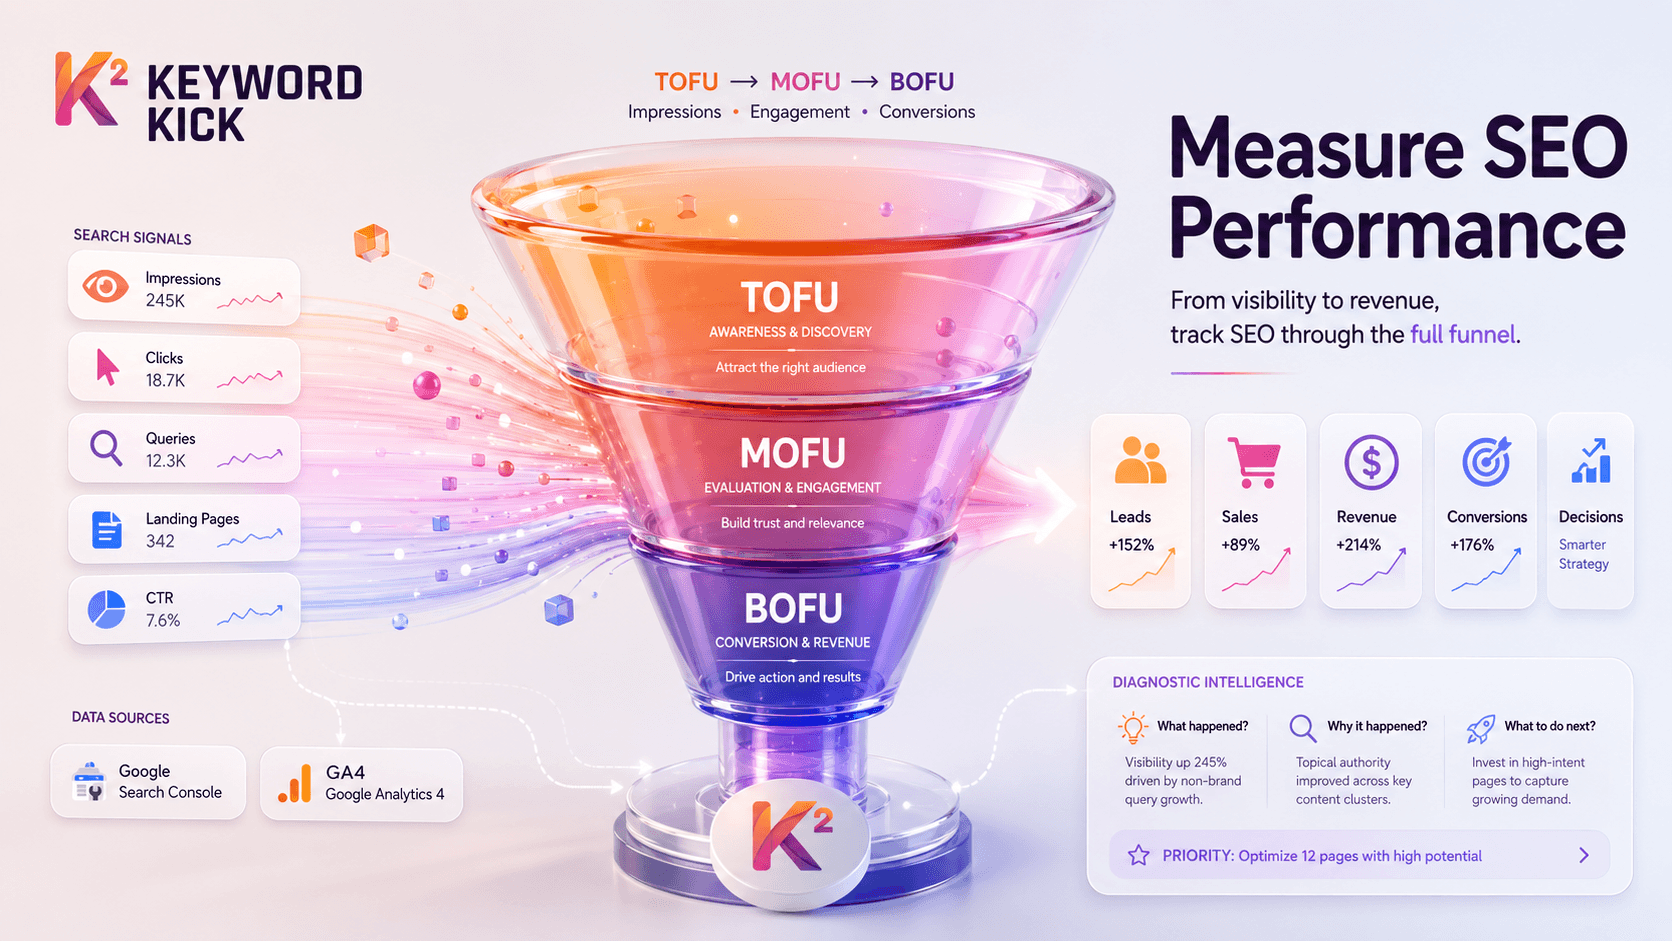
A simple way to make SEO reporting useful is to classify pages into TOFU, MOFU, and BOFU.
TOFU pages attract people who are learning, comparing, or framing a problem. Think blog posts, glossary pages, educational resources, and broad category guides. These pages usually earn visibility first, then clicks, then assisted conversions later.
MOFU pages help visitors evaluate options. Product pages, solution pages, comparison pages, and use-case pages often sit here. These pages should be judged more heavily on engagement quality and movement deeper into the site.
BOFU pages are where conversion intent becomes concrete. Pricing pages, demo pages, signup flows, cart pages, and checkout pages belong here. If SEO reaches this layer and doesn't produce measurable action, you have a business problem, not just a traffic problem.
Mapping SEO KPIs to Funnel Stages
Funnel Stage | Primary Goal | Key SEO KPIs |
|---|---|---|
TOFU | Build awareness and attract relevant search demand | Organic impressions, clicks, query themes, landing page engagement |
MOFU | Move visitors into evaluation and consideration | Engagement rate on product or solution pages, navigation to deeper pages, assisted conversions |
BOFU | Drive conversion and commercial outcomes | Organic-driven conversions, checkout or lead completion, revenue contribution |
This framework forces better conversations. A TOFU article with growing impressions but weak clicks may need SERP snippet work. A MOFU page with traffic but poor engagement may have an intent mismatch. A BOFU page with qualified organic visits but poor conversions may have UX friction, weak offers, or tracking problems.
What Good Goal Setting Looks Like
Good SEO goals are specific to page purpose and tied to business outcomes. They don't rely on vague ideas like “improve rankings” or “grow visibility.” Those can matter, but only if they support a commercial result.
Use questions like these:
For TOFU: Are the right topics earning impressions and clicks from relevant queries?
For MOFU: Are visitors engaging with product or category pages after entering through search?
For BOFU: Are organic users completing the actions the business cares about?
If your reporting can answer those three questions clearly, you're already ahead of most SEO teams.
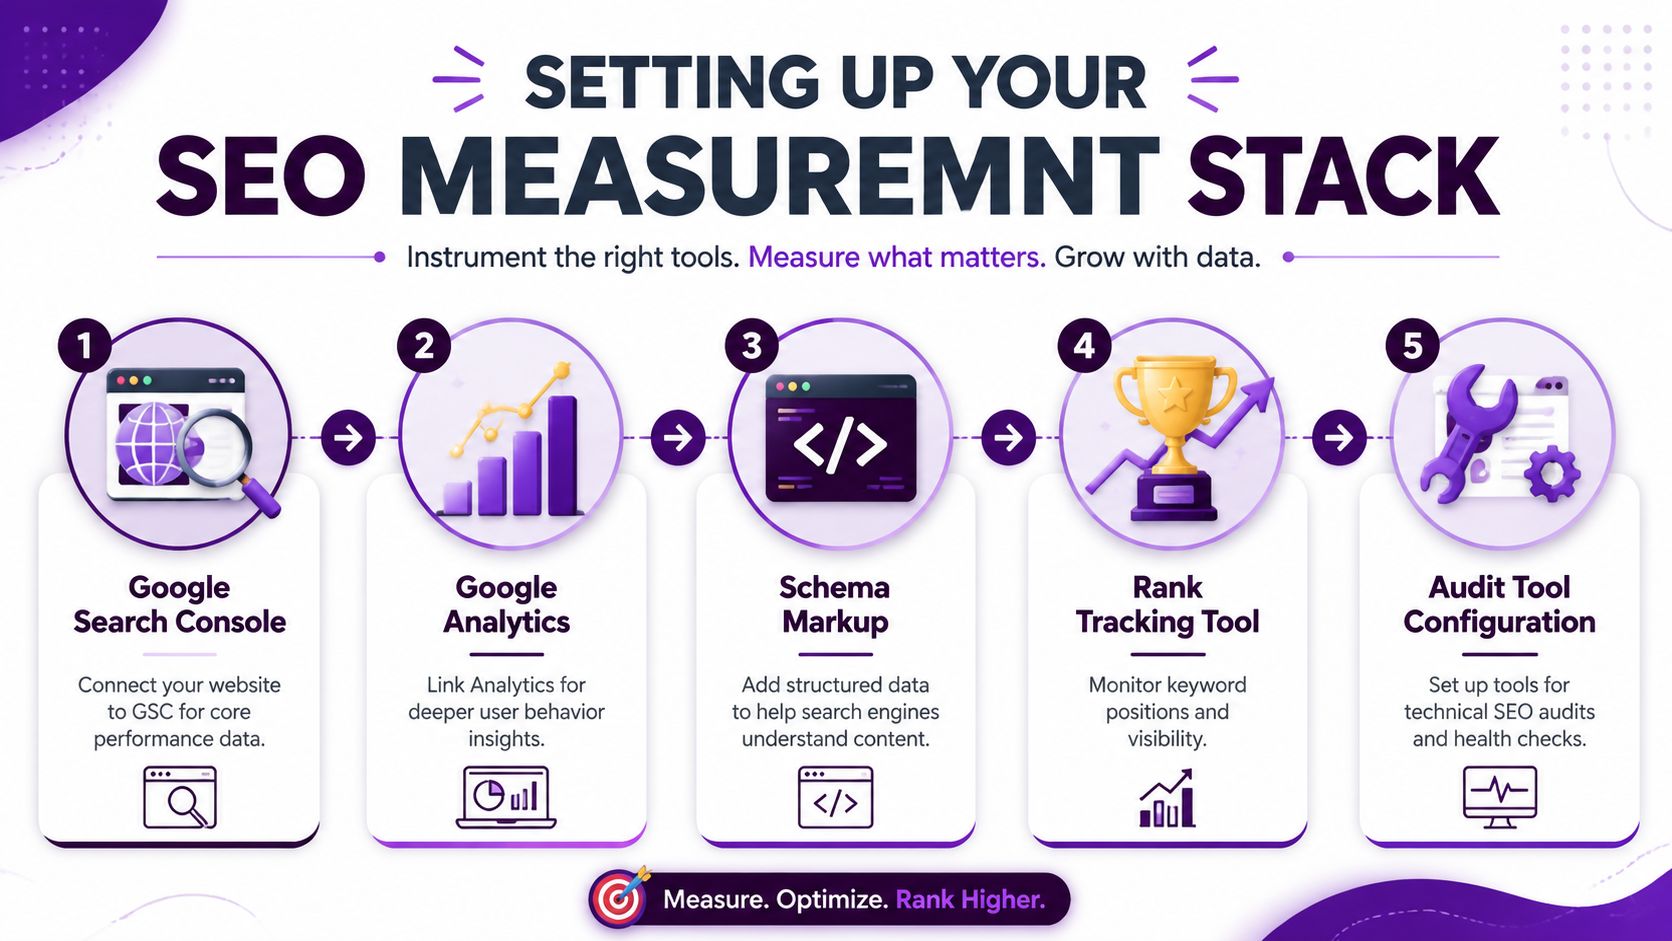
Instrumenting Your SEO Measurement Stack
Once the goals are clear, setup matters more than dashboards. Bad instrumentation creates fake certainty. Good instrumentation gives you a clean path from query to landing page to conversion.
The foundation is still Google Search Console plus Google Analytics 4. That combination lets you connect search visibility with actual on-site behavior. According to Walk With Pic's methodology for measuring SEO performance, the process should start with a 28-day year-over-year comparison of impressions and clicks, then extend into page and query analysis inside GSC and conversion tracking inside GA4. The same source reports a 75% success rate among agencies using this dual-platform approach consistently.
Start With Search Console, Not a Rank Tracker
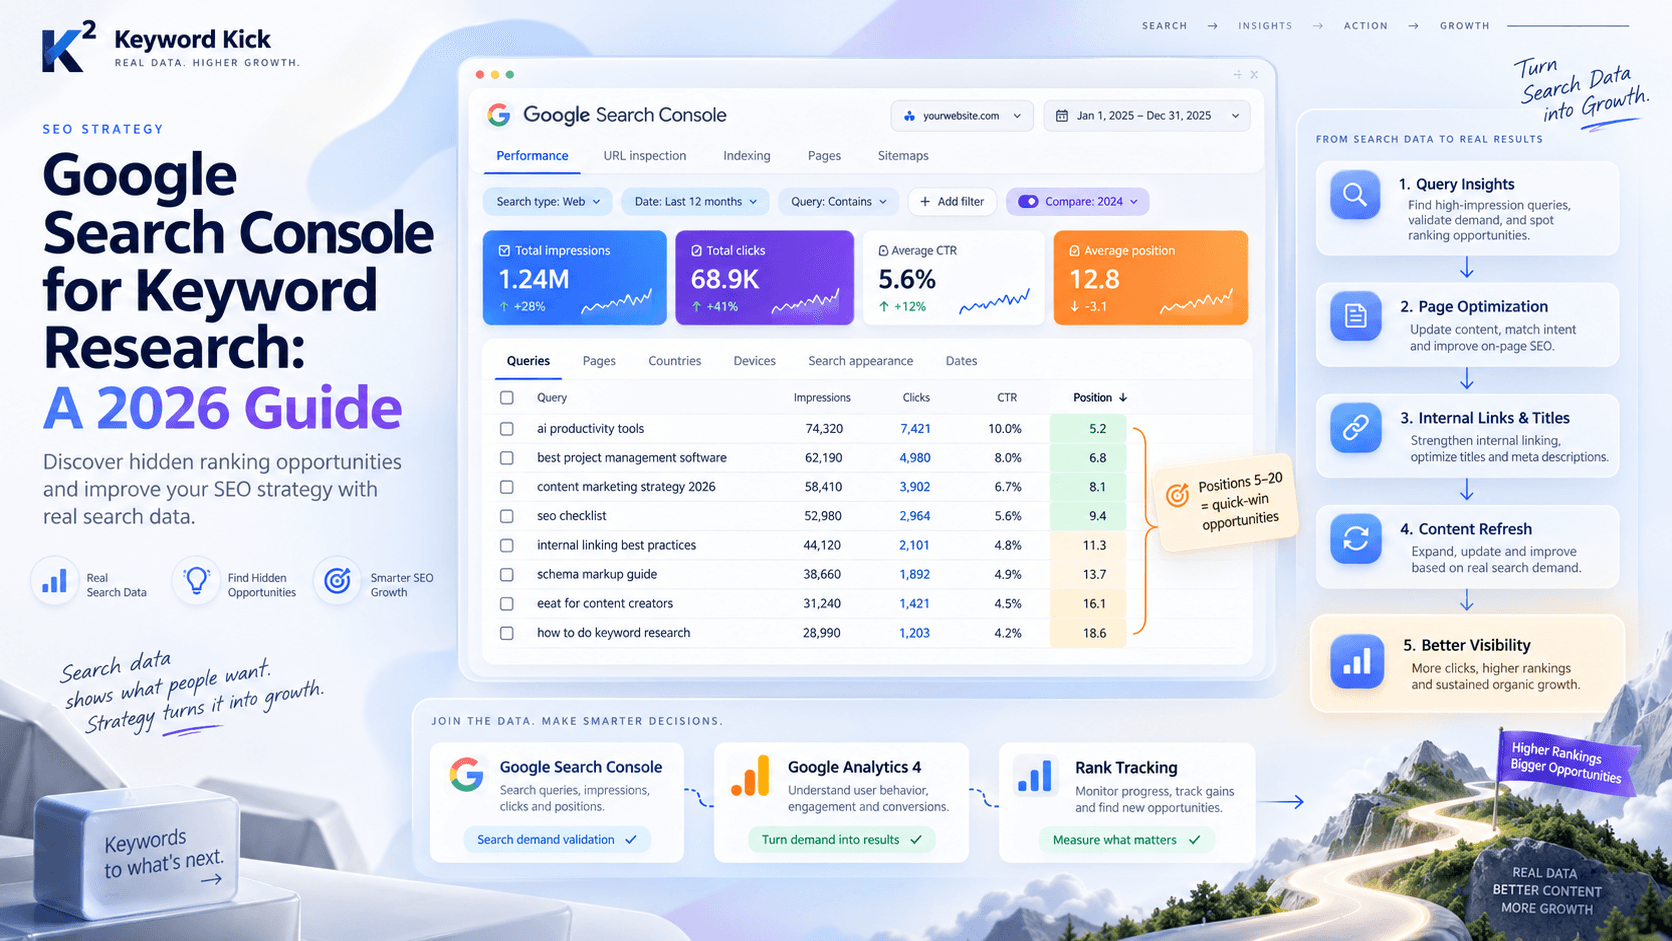
Search Console tells you how Google is exposing your pages. That means impressions, clicks, and query-level visibility at the page level. It's the first place to look when something changed in search demand, snippet performance, or page visibility.
Set up and verify the correct property. Then make sure your team reviews performance by:
Page first so you can isolate which URLs gained or lost visibility.
Query second so you can see whether the page shifted for the terms that matter.
Comparison mode using a recent period against a year-over-year baseline, especially for seasonal sites.
That order matters. Too many teams start with sitewide traffic and never identify the page or query that caused the movement.
Configure GA4 Around Funnel Actions
GA4 is where SEO stops being a visibility report and becomes a business report.
The most useful setup is to define conversion events that reflect movement through the funnel. For example:
TOFU actions might include deeper content engagement or movement from blog content into product areas.
MOFU actions might include viewing key product pages, comparison pages, or lead-intent interactions.
BOFU actions include form submissions, demo requests, purchases, or checkout completion.
GA4 won't infer your funnel for you. You need to create the events and mark the outcomes that matter. If you're refining your setup, this guide to Google Analytics for SEO is a useful reference for tying GA4 reporting back to search performance.
SEO reporting breaks when GA4 tracks pageviews but not decisions.
Use Attribution Carefully
A common mistake is claiming too much value from SEO because a user touched an organic page at some point. A better approach is conservative attribution. Track entry pages, supporting pages, and conversion pages separately so you can distinguish influence from final conversion.
UTM discipline also matters when organic and other channels overlap. Without it, teams often misread branded searches, email-driven return visits, or campaign traffic as pure SEO performance. That creates bad budget decisions later.
If you need a broader view of how channel measurement works, Machine Marketing's explanation of marketing analytics gives useful context for how attribution and reporting frameworks fit together.
Fill the Gaps With Supporting Tools
GSC and GA4 are the core. They are not the full stack.
Many teams still require additional tools for:
Rank tracking to monitor target keyword movement outside GSC's limited views
Backlink analysis to understand authority trends and off-page support
Technical audits to catch crawl, rendering, indexation, and site health problems
Behavior analysis such as heatmaps or session review tools when traffic arrives but users stall
Some teams manage this with separate products. Others centralize it. Platforms such as Keyword Kick combine GA4, GSC, rank tracking, backlinks, and technical signals in one workspace so page-level analysis doesn't live across five tabs and a spreadsheet.
Building a Meaningful SEO Performance Dashboard
Most SEO dashboards are full of numbers and empty of judgment.
You'll see sessions, users, average position, and maybe a graph that looks busy enough to feel important. Then the meeting starts, someone points at a dip, and nobody can say whether it affected pipeline, leads, or revenue. That dashboard failed.
A good dashboard answers three questions fast: what changed, where it changed, and whether it mattered.

Remove Metrics That Create Noise
One metric deserves special scrutiny: average position.
Expert guidance explicitly warns that average position should not be analyzed because it distorts true keyword performance. The same source also notes that Google Search Console retains only 16 months of data, which limits long-term analysis unless you export or use other tooling (NerdCow on measuring SEO performance).
That's why dashboards built around average position usually mislead teams. A page can rank for many low-value terms and still look stable. Another page can lose one critical commercial query and barely move the sitewide average. The metric smooths over what you need to know.
What a Bad Dashboard Looks Like
A weak SEO dashboard usually has these traits:
Sitewide aggregation only with no page-type or funnel segmentation
Traffic totals without intent so a blog visit and a checkout visit count the same
Average position as a headline KPI even though it hides query-level reality
No conversion view so leadership sees movement but not business effect
No retention plan for history which becomes a problem once GSC data ages out
That kind of dashboard makes SEO look either better or worse than it is, depending on the month.
What to Include Instead
A useful dashboard separates leading indicators from lagging indicators and maps both to the funnel.
Leading indicators
TOFU visibility trends by page group and query cluster
Clicks from high-priority search themes
CTR by important landing pages
MOFU engagement patterns on product, category, or solution pages
Lagging indicators
Assisted conversions from organic landing pages
BOFU conversion completion for pages with strong commercial intent
Revenue contribution or lead generation tied to organic entry paths
A strong dashboard also groups URLs by purpose. Blog content should not sit in the same chart as pricing, product, and checkout pages without segmentation.
Build dashboard views the way the business makes money, not the way the tools export data.
A Simple Dashboard Layout That Works
Use one section for each funnel stage, then add a final business-outcome panel.
Dashboard Area | What to Show | Why It Matters |
|---|---|---|
TOFU | Impressions, clicks, top landing pages, top query groups | Shows whether awareness content is earning attention |
MOFU | Engagement rate, page paths, assisted conversions | Reveals whether search traffic is evaluating your offer |
BOFU | Conversion events, checkout or lead completions, landing pages driving them | Connects SEO to commercial outcomes |
Executive View | Trend notes, major gains/losses, actions taken | Helps stakeholders understand cause and next steps |
If you report to ecommerce or finance stakeholders, it can help to study dashboard design outside SEO too. This guide on how to build your D2C profit dashboard is useful because it keeps the focus on decision-making rather than metric clutter.
For agencies or internal reporting workflows, this resource on SEO reporting for clients and what to skip is a practical template for trimming vanity metrics and highlighting what matters.
Analyzing Trends and Troubleshooting Performance Drops
Reporting shows the symptom. Analysis finds the cause.
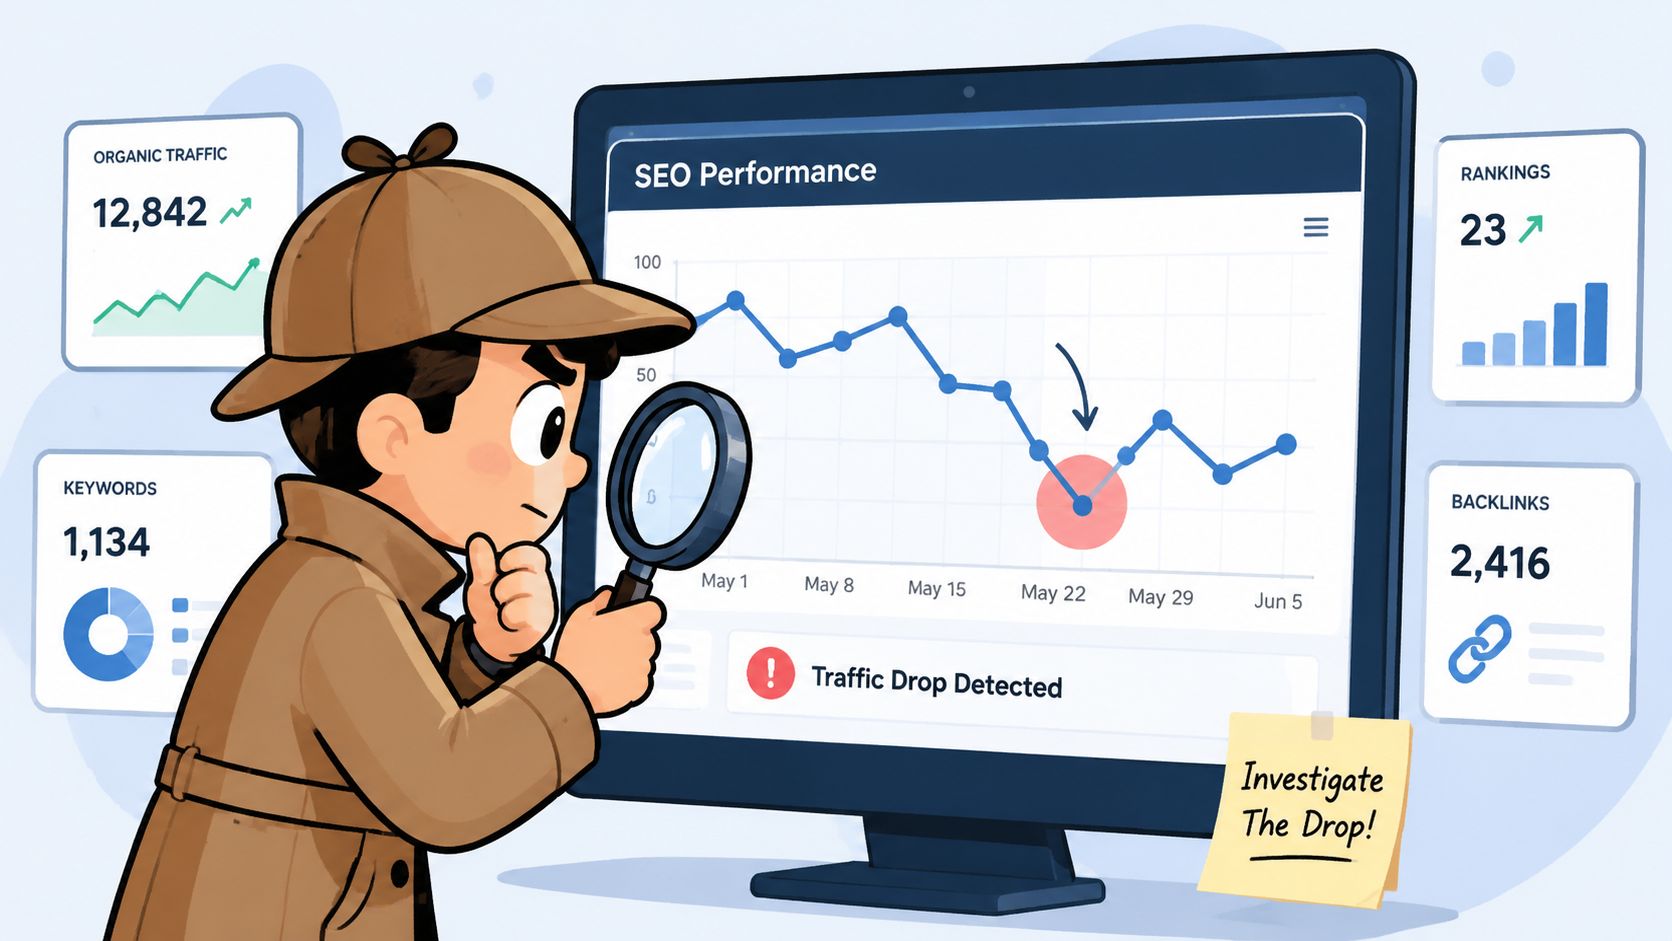
When traffic drops on an important page, don't jump straight to “rankings fell” or “Google updated something.” Start narrower. Look at one page, one date range, one query set, and one business impact. The goal is to explain the drop in a way that leads to action.
Follow a Diagnostic Sequence
A practical troubleshooting sequence looks like this:
Confirm the scope
Is the decline isolated to one URL, a template type, a folder, or the whole site?Check Search Console page data
Look at impressions and clicks first. If impressions fell, visibility likely changed. If impressions held but clicks fell, CTR may be the issue.Segment by query
Identify whether the page lost visibility on a few important terms or across the board. A concentrated loss often points to intent mismatch or stronger competing pages.Review GA4 behavior
If search traffic still arrives but engagement or conversion drops, the problem may be on-page, not in the SERP.Validate technical health
Check indexability, rendering, canonicals, internal links, and page experience issues.
Read the Pattern Before Taking Action
Different patterns point to different causes.
If a page loses impressions and clicks together, Google may be surfacing it less often. That could come from content decay, weaker internal linking, a technical issue, or stronger competing results.
If impressions stay steady but clicks fall, the page still appears but searchers choose other results. In practice, this often means the title tag, meta description, or SERP context lost appeal. It can also mean a SERP feature pushed classic organic results lower.
If clicks and sessions hold but conversions drop, SEO didn't necessarily fail. The page may still attract the right audience, but the next step on the site may be broken, confusing, or mismatched to intent.
Don't diagnose an SEO drop from one graph. Search visibility, on-site behavior, and conversion data each tell a different part of the story.
A Common Scenario
Take a product page that was driving steady organic traffic and then starts slipping.
You open GSC and see impressions down on the page. Next, you segment queries and notice losses are concentrated around comparison-style searches rather than broad product terms. That tells you the issue may not be the entire page. It may be that competing pages now answer evaluation intent better.
Then you open GA4 and see that visitors who still land on the page engage normally once they arrive. That's useful. It suggests the page experience is fine. The issue is likely visibility or message fit in search, not a conversion problem after the click.
At that point, your action list becomes much cleaner: update the content to better match comparison intent, improve internal linking from supporting evaluation pages, and inspect the SERP to see what formats are winning now.
If a broader visibility shift lines up with known search volatility, keep an eye on developments around Google algorithm updates and what changed, but don't use updates as a shortcut explanation before you've checked page-level evidence.
Compare Trends in Context
Month-over-month views are useful for recent movement. Year-over-year views are better for seasonality. Both matter. What matters more is comparing like with like.
Evaluate:
The same page type
The same intent bucket
The same stage of the funnel
The same conversion expectation
That keeps you from overreacting to ordinary fluctuations and helps you spot genuine performance changes faster.
Turning Insights into Prioritized Actions
Analysis only matters if it changes what the team does next.
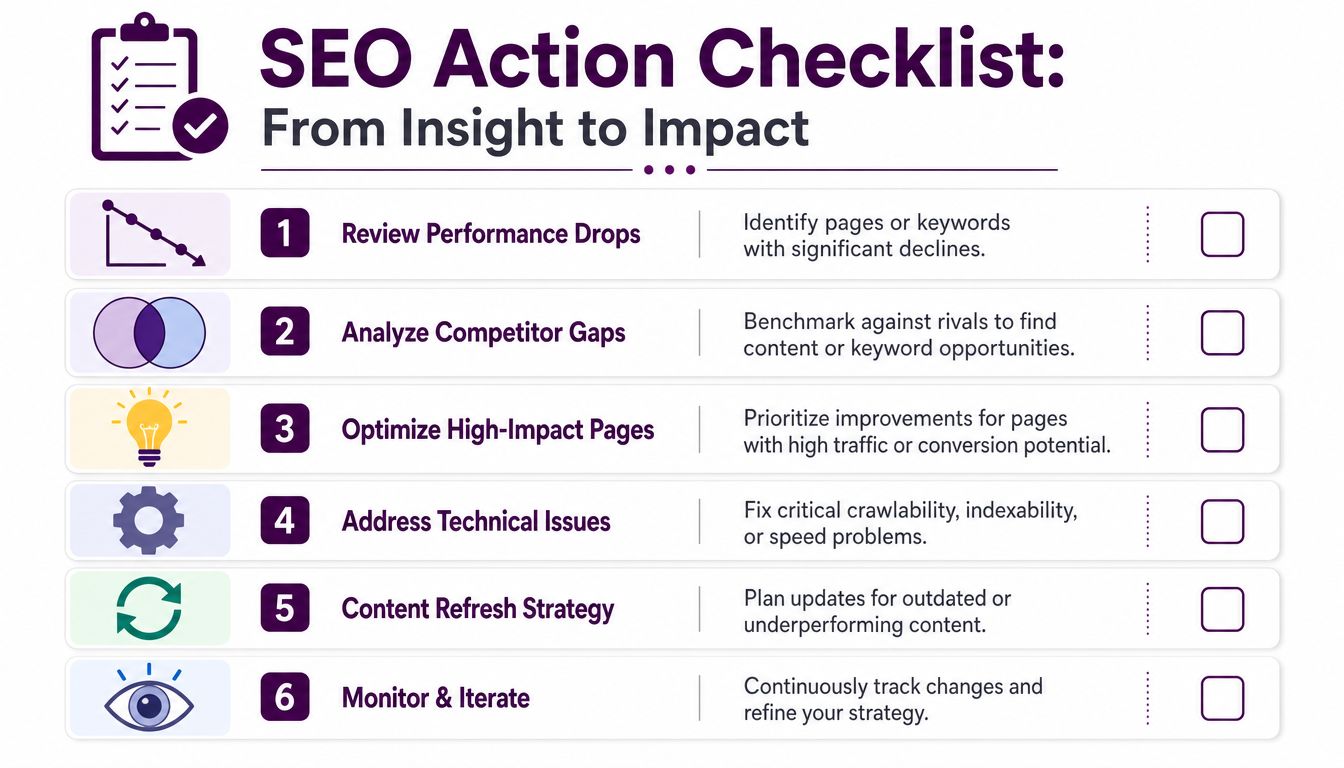
The fastest way to waste SEO reporting is to turn every finding into an equal-priority task. They aren't equal. Some fixes affect revenue pages. Some affect early-stage content. Some are technically urgent but commercially minor. Prioritization is the bridge between insight and impact.
Use an Effort and Impact Filter
A practical prioritization pass uses two questions:
How much business value could this recover or create?
How hard is it to implement well?
That gives you four broad action types:
Priority Type | What It Usually Includes | How to Treat It |
|---|---|---|
High impact, low effort | Updating title tags, improving internal links, refreshing a strong page slipping on key queries | Do first |
High impact, high effort | Reworking a core template, rebuilding BOFU pages, resolving major technical blockers | Plan and resource properly |
Low impact, low effort | Minor metadata cleanup on low-value pages | Batch when time allows |
Low impact, high effort | Large projects with weak commercial upside | Usually defer |
Choose Actions by Funnel Stage
A page's funnel role should shape the next move.
For TOFU, common high-value actions include refreshing decayed content, tightening topic targeting, and rewriting snippets to improve clickthrough. These pages earn attention first. Their job is to pull qualified users into the site.
For MOFU, look at intent alignment and page paths. If organic visitors land on product or solution pages but don't move deeper, improve page structure, comparison content, internal links, and calls to action that fit an evaluation mindset.
For BOFU, friction matters more than volume. If organic users reach high-intent pages and don't convert, inspect form UX, offer clarity, trust signals, and technical issues in the conversion flow before you spend more effort chasing additional traffic.
Action test: If you can't explain how a recommended SEO task could improve a funnel stage, it probably isn't a priority.
Turn Findings Into a Repeatable Workflow
A simple operating rhythm works well:
Review changes weekly for early signals on visibility and page behavior
Investigate monthly at the page and query level for trends worth acting on
Prioritize quarterly so larger technical and content bets align with business goals
The goal isn't to create more tickets. It's to create better ones.
A strong action loop sounds like this: this page lost visibility on these queries, it supports this funnel stage, the likely cause is this, and the recommended fix is this. That's what mature SEO measurement looks like. Not more charts. Better decisions.
Conclusion From Data to Decisions
SEO measurement gets easier once you stop trying to summarize everything in one number.
The useful question isn't “Did traffic go up?” It's “Which pages moved, for which queries, at which funnel stage, and did that change business outcomes?” That's how you measure SEO performance in a way stakeholders can trust.
The pattern is straightforward. Define goals by funnel stage. Instrument GSC and GA4 so visibility connects to behavior and conversions. Build dashboards that remove vanity metrics and highlight what changed. Diagnose drops by page and query, not by assumption. Then turn those findings into a prioritized action list.
That's the difference between reporting and management.
When your measurement framework is solid, you can answer the questions that matter. What happened. Why it happened. What to do next. And whether SEO is contributing to leads, sales, or revenue instead of just generating charts.
If you want one place to connect GSC, GA4, rankings, backlinks, and technical signals so your team can move from raw data to clear next steps, Keyword Kick is built for that workflow. It helps agencies, in-house teams, and consultants see what changed, where it changed, and which SEO actions deserve priority next.