
Your SEO report says the site ranks in the top 10 for hundreds of keywords. The competitor report says another domain ranks for far fewer. Yet when the revenue team asks which brand is winning search, the answer isn't obvious. The second site may own the valuable positions, while the first collects low-demand rankings that look impressive in a spreadsheet but produce little commercial visibility.
That's the problem share of voice SEO should solve. Properly modeled, it shows the share of eligible organic click opportunity a site captures, not merely how often it appears somewhere on page one. It also exposes where rankings lose value because of SERP features, AI Overviews, weak snippets, or search intent mismatch.
The Two Sites Problem and Why Visibility Alone Misleads
Consider two competing software companies tracking the same keyword universe. Site A ranks in the top 10 for many terms, including a large group of informational queries with limited demand. Site B ranks for fewer terms, but it holds positions near the top for the category's strongest commercial searches.
A conventional visibility report may favor Site A because it counts more rankings. The traffic reality can favor Site B because ranking position and keyword demand determine how much attention a result can capture. Treating every top-10 placement as equal makes a position 1 ranking look no different from a position 10 ranking, even though searchers don't behave that way.
An analysis of 4 million search results, covering 1,312,881 web pages and 12,166,560 search queries, found that the first organic result received an average 27.6% click-through rate, while the top three collectively captured 54.4% of clicks. The first result was also approximately 10 times more likely to receive a click than the result in position 10. See the full Google organic click-through-rate analysis for the underlying research.
Why the ranking count breaks down
Suppose one page ranks fifth for a high-demand commercial query, while another page moves from position 20 to position 11 for a low-demand informational term. The second movement sounds larger in a ranking report, but the first page may have the stronger opportunity because it sits closer to the part of the results page where click capture changes quickly.
That distinction matters for budget decisions. A content refresh, internal-linking campaign, or authority-building effort should target the keyword where a realistic ranking lift can produce meaningful additional clicks, not just the keyword with the most room to move.
Practical rule: A ranking is an observation. Share of voice is an estimate of the attention and opportunity that ranking can create.
Paid-search teams already face a related measurement issue. Google Ads Auction Insights doesn't tell you organic SOV, but learning what Auction Insights really shows can help your team keep paid auction metrics separate from organic competitive visibility.
The useful question isn't, “How many keywords do we rank for?” It's, “How much of the available, relevant click opportunity do we capture, and where are competitors displacing us?” That reframing turns SOV from a vanity percentage into a planning metric.
What Share of Voice SEO Actually Measures
SEO share of voice measures the proportion of eligible organic click opportunity captured by your site across a defined keyword set. The model should account for at least three variables:
- Search demand, usually represented by keyword volume or another demand estimate.
- Ranking position, because higher results generally receive more clicks.
- Competitive opportunity, meaning the click potential available across the domains included in the comparison.
The weak version of SOV is the percentage of tracked keywords where your domain ranks in the top 10. That can be useful as a quick diagnostic, but it ignores the difference between a high-demand term at position 2 and a low-demand term at position 9.
The working formula
A practical weighted model is:
Weighted SOV = Σ(search volume × estimated CTR at your rank) ÷ Σ(search volume × estimated CTR for all competing results)
This approach follows the click-concentration pattern identified in search-behavior research. One study found that the first result received 51.3% of clicks, positions one through five captured more than 86%, and 97.11% of clicks went to the first results page, as reported in the search-behavior study on click distribution.
For each keyword, multiply its demand estimate by the CTR curve value assigned to your ranking position. Repeat that calculation for each competitor, then add the resulting weighted clicks across the keyword set.
A one-keyword example
The following example uses illustrative CTR and volume inputs to show the mechanics. The numbers in the table are not a market benchmark. They're placeholders you can replace with your own keyword data and market-specific CTR curve.
| Domain | Rank | Est. CTR | Monthly Volume | Weighted Clicks |
|---|---|---|---|---|
| Your site | 2 | 0.15 | 1,000 | 150 |
| Competitor A | 1 | 0.28 | 1,000 | 280 |
| Competitor B | 5 | 0.06 | 1,000 | 60 |
For this simplified comparison, the tracked sites have 490 weighted clicks in total, and your site contributes 150. Its modeled SOV is therefore 150 ÷ 490, expressed as a percentage. In a production model, you'd use observed or modeled SERP behavior for the relevant market, include qualifying SERP features, and calculate across many keywords rather than one.
If you lack reliable competitor rank data, use Google Search Console as a sanity check. Compare your impressions and clicks for the same keyword segments, then calculate observed click share against the combined data available to your team. This won't replace a modeled competitive denominator, but it can reveal whether your modeled opportunity resembles actual performance.
Segment the report by market, device, intent, brand versus non-brand terms, landing page, and SERP feature type. A blended score can hide the exact place where your strategy is winning or failing.
How Share of Voice Differs From Impression Share and CTR
SEO teams often place several metrics beside one another and assume they answer the same question. They don't. Each metric describes a different part of the search journey.
| Metric | What it measures | Best use | What it misses |
|---|---|---|---|
| SEO SOV | Your weighted share of organic click opportunity against competitors | Competitive prioritization and market visibility | Model assumptions and untracked competitors |
| Paid impression share | Your share of eligible paid-search auction impressions | Google Ads budget and bidding decisions | Organic rankings and organic click opportunity |
| CTR | Clicks divided by impressions for your result | Snippet and intent diagnosis | Visibility you never received |
| Average position | An aggregate position value across impressions | Directional ranking movement | The sharp difference between individual positions |
| Visibility index | A tool-defined weighted ranking score | Trend monitoring within one platform | The effect of intent, device, SERP layout, and business value |
Impression share belongs to paid search. It describes eligible ad auctions, not the organic demand available to your pages. A paid impression-share increase shouldn't be reported as an SEO visibility gain.
CTR is also narrower than SOV. A page can have an attractive CTR because it receives qualified impressions, while another page has a poor CTR because it rarely appears in competitive positions. CTR helps you diagnose title tags, descriptions, intent alignment, and SERP competition. It doesn't tell you how much visibility your competitors capture when you don't appear.
Average position creates a different trap. It compresses many query-level realities into one number, so a change can look positive even when the business value of the affected keywords falls. A visibility index may be useful for a consistent trend line, but static weights can conceal differences between branded and non-branded terms or between commercial and informational intent.
Reporting test: If a metric doesn't help you choose a keyword, page, market, or action, don't present it as a substitute for SOV.
For a broader discussion of separating meaningful outcomes from surface-level reporting, see Sensoriium's guidance on stop tracking vanity numbers. Use SOV as the competitive opportunity layer, then use impressions, CTR, clicks, and conversions to validate what that opportunity produces.
Building a Share of Voice Tracking Workflow That Actually Works
A useful SOV workflow starts with a controlled dataset. Don't begin by exporting every keyword a tool can find. Define the market, competitor set, search locations, devices, and keyword groups that reflect the decisions your team needs to make.
Your core inputs should include:
- Google Search Console data, including impressions, clicks, queries, pages, and devices.
- A rank tracker, configured for the relevant market and device.
- A curated keyword set, grouped by intent, topic, landing page, and brand status.
- A competitor list, including domains that compete for visibility even when they don't sell the same product.
- SERP observations, recording features that change the available organic click opportunity.
A single working sheet might use these columns:
Keyword | Search volume | Intent | Market | Device | Landing page | Your rank | Competitor rank | CTR at your rank | Competitor CTR | Your click potential | Competitor click potential
The sheet should preserve the original keyword set and the date of every snapshot. If Google changes the SERP layout, you need to know whether a visibility change came from your ranking movement or from a smaller click opportunity on the page.
Refresh and validate the model
A daily rank tracker can identify movement, but leadership reporting should distinguish durable change from short-term noise. Refresh the underlying data on a cadence that matches your market, preserve historical snapshots, and review the keyword set whenever products, markets, or search behavior change.
The most important validation compares modeled SOV with observed Search Console click share. If modeled visibility rises while clicks remain flat, investigate the gap instead of declaring success. Possible explanations include a weak snippet, a mismatch between page and intent, a feature absorbing attention, personalization, or an inaccurate CTR curve.
Ranking position has a causal effect on click probability. A peer-reviewed study found that moving a result from rank 1 to rank 2 reduced click odds by approximately one-third to two-thirds, depending on the query, as documented in the research on search-result position and click behavior. That makes rank transitions worth tracking at the URL-query level, not just as an average across the site.
Teams that need a repeatable process can use automated SEO campaign setup to organize rank tracking before building the SOV layer.
The AI Overview Blind Spot in Traditional SOV
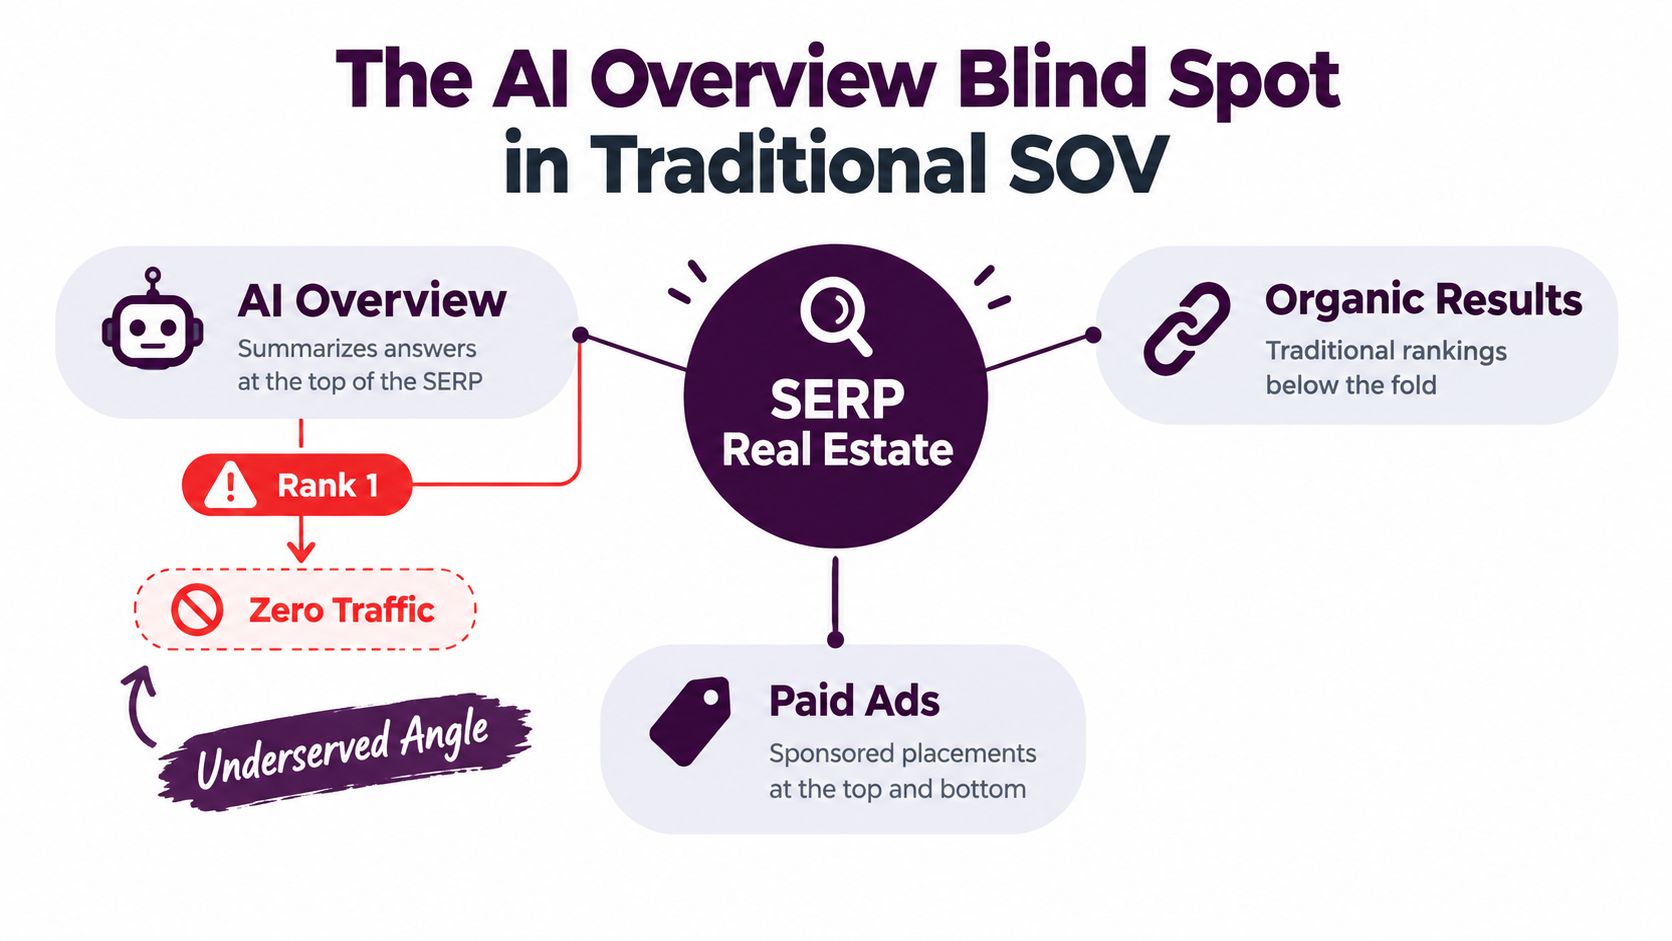
Traditional SOV assumes that a strong organic position creates a corresponding click opportunity. AI Overviews challenge that assumption. A page can hold a prominent organic ranking while the searcher gets a direct answer above the traditional results, and a cited source can gain exposure without receiving a visit.
A 2025 study covering 53 brands, 5.47 million queries, and 2.43 billion impressions found approximately 3.3% CTR for queries without an AI Overview, 2.1% when an Overview included a citation, and 0.9% when it didn't. Separate research reported AI Overviews for about 18% of analyzed U.S. searches, with traditional-result clicks falling from 15% to 8% when an Overview appeared, according to Search Engine Land's analysis of AI Overview click behavior.
These findings don't make ranking data useless. They make it incomplete. A citation can support credibility or consideration even when the immediate session doesn't appear in analytics, while a high organic position can produce less traffic than an older CTR model predicts.

Report four kinds of visibility
Don't force AI exposure and organic traffic into one unexplained percentage. Report separate measures:
- Ranking share, the weighted presence of your pages in traditional results.
- AI-answer citation share, the proportion of tracked answers that cite your content.
- Brand-mention share, how often your brand appears in generated answers, whether or not it receives a citation.
- Resulting visits or conversions, the attributable business response from measurable sessions.
Segment those measures by intent, market, device, product, and citation status. A brand can have strong ranking share but weak citation share, or gain citation visibility without a corresponding increase in immediate visits.
Teams working with local entities also need to monitor the AI surface separately. RecensioAI B.V. offers a practical resource on how to track local brand visibility in AI platforms. For a deeper operating model, use Keyword Kick's AI tracking guide alongside your traditional rank report.
Turning Share of Voice Into a Prioritized Action Plan
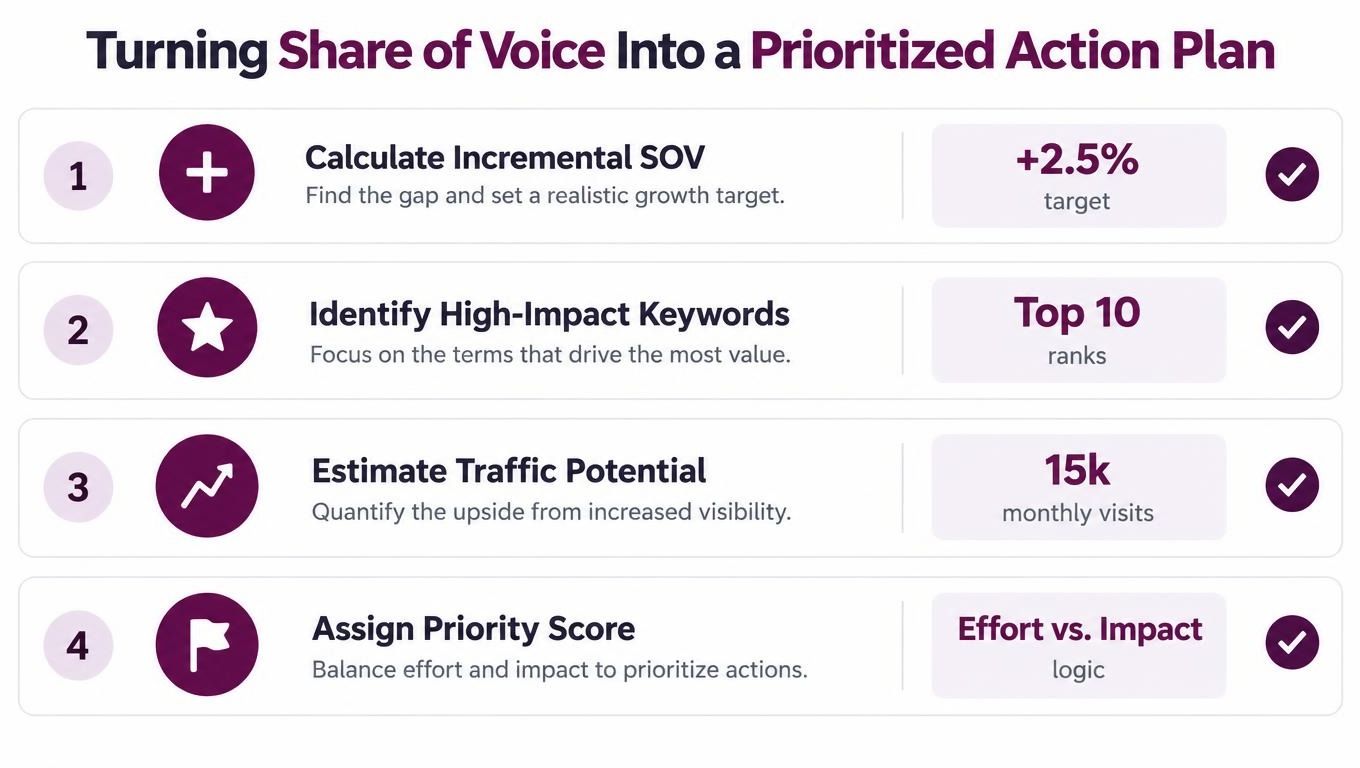
A SOV number only becomes useful when it changes the order of work. For each keyword and URL, calculate incremental SOV as the estimated clicks at a realistic target rank minus the estimated clicks at the current rank.
That calculation gives you a practical opportunity list. It asks what a ranking improvement could add, rather than rewarding a keyword just because it has a large gap between its current position and position 1.
Start where the curve is steep
The click distribution pattern has remained sharply concentrated near the top. Slingshot SEO reported approximately 18% CTR for Google's first organic listing across 624 non-branded keywords in 2011. A 2020 analysis reported average CTRs of 28.5% for position 1, 15% for position 2, 11% for position 3, and 2.5% for position 10, while second-page results attracted under 1% per position, as summarized by Search Engine Land's historical CTR review.
Use that pattern to guide effort:
- Prioritize positions 2 through 5 when the page has strong relevance and meaningful impressions. A small gain may produce more incremental clicks than a major improvement below page one.
- Favor high-demand commercial terms where the target rank is realistic and the landing page can satisfy the query.
- Treat page-three opportunities selectively. A low ranking doesn't automatically justify a full content rebuild. Confirm that demand, intent, authority, and SERP conditions support the investment.
- Discount eroded opportunities. If an AI Overview, featured answer, map pack, or shopping module absorbs attention, reduce the expected click value and consider citation or brand exposure separately.
Connect the score to outcomes
A practical action queue should include the keyword, current rank, target rank, estimated incremental clicks, page, likely intervention, effort, and business value. The intervention might be a title rewrite, internal links, content expansion, technical repair, digital PR, or a new comparison page.
Track four outcome layers:
- Modeled SOV, the opportunity-weighted estimate.
- Observed click share, based on Search Console performance.
- The model gap, the difference between expected and actual click capture.
- Incremental conversions, tied to the pages and query groups affected.
A platform such as Keyword Kick can keep competitor rankings, visibility trends, SERP features, and related SEO signals in one workspace. If your team needs a focused SEO reporting tool, use it to connect the SOV opportunity list with the pages and actions that need attention.
Your Quarterly Share of Voice Field Guide
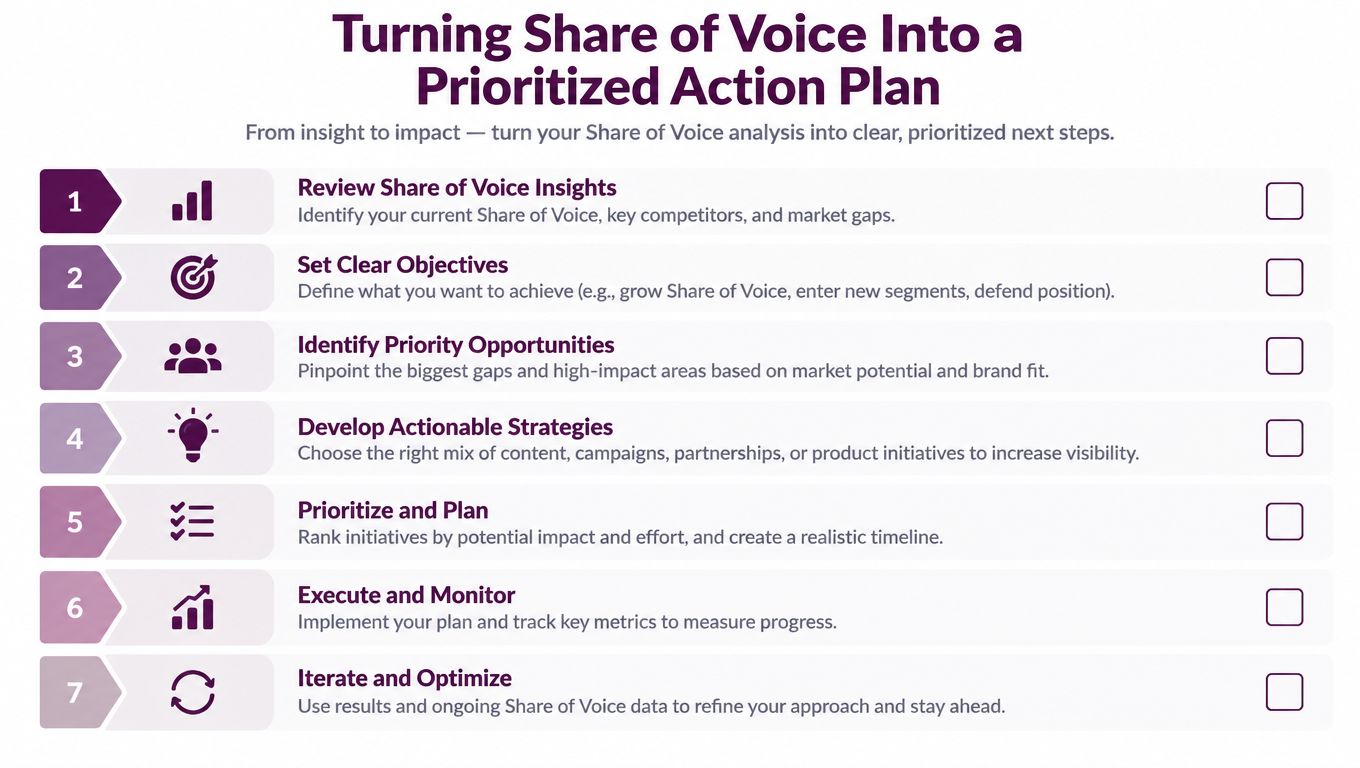
A quarterly SOV review should leave your team with a ranked list of decisions, not another dashboard screenshot. Start by defining the keyword universe around your market, products, competitors, and revenue-relevant intent. Keep brand and non-brand terms separate, then segment by device, market, landing page, and SERP feature.
Use the weighted model:
Estimated organic opportunity captured ÷ total estimated opportunity across tracked competitors
Calculate the numerator from demand and rank-adjusted CTR, then compare the result with actual Search Console impressions and clicks. Preserve the snapshot so the next review can distinguish lost rankings from a change in click opportunity.
The review checklist
- Check the dataset. Remove irrelevant terms, identify missing competitors, and confirm that the keyword set still reflects the market.
- Segment the results. Review brand, non-brand, intent, device, market, topic, and landing-page groups separately.
- Compare modeled and observed share. A widening gap deserves investigation, not automatic optimism.
- Record SERP conditions. Note AI Overviews and other features that alter traditional organic click potential.
- Separate AI visibility. Report ranking share, citation share, brand mentions, and attributable visits or conversions independently.
- Rank incremental opportunities. Focus on realistic gains near the top of the results, especially for commercially valuable queries.
- Assign owners and dates. Every priority should connect to a page, action, responsible team, and review point.
Avoid four common reporting errors. Don't call paid impression share organic SOV. Don't treat every top-10 ranking as equal. Don't celebrate visibility on a query that Google answers without creating meaningful click opportunity. And don't hide a large modeled-versus-observed gap inside a single blended score.
The most useful quarterly question is simple: which lost or unrealized visibility can this team recover with the next set of actions? Build the model, validate it against Search Console, add the AI visibility layer, and direct resources toward the opportunities with the strongest combination of click potential, relevance, and business value.
Keyword Kick connects competitor rankings, Google Search Console data, SERP features, and visibility trends so teams can turn share of voice data into prioritized SEO actions. Visit Keyword Kick to evaluate the workflow for your own market and start building a more honest SOV report.