
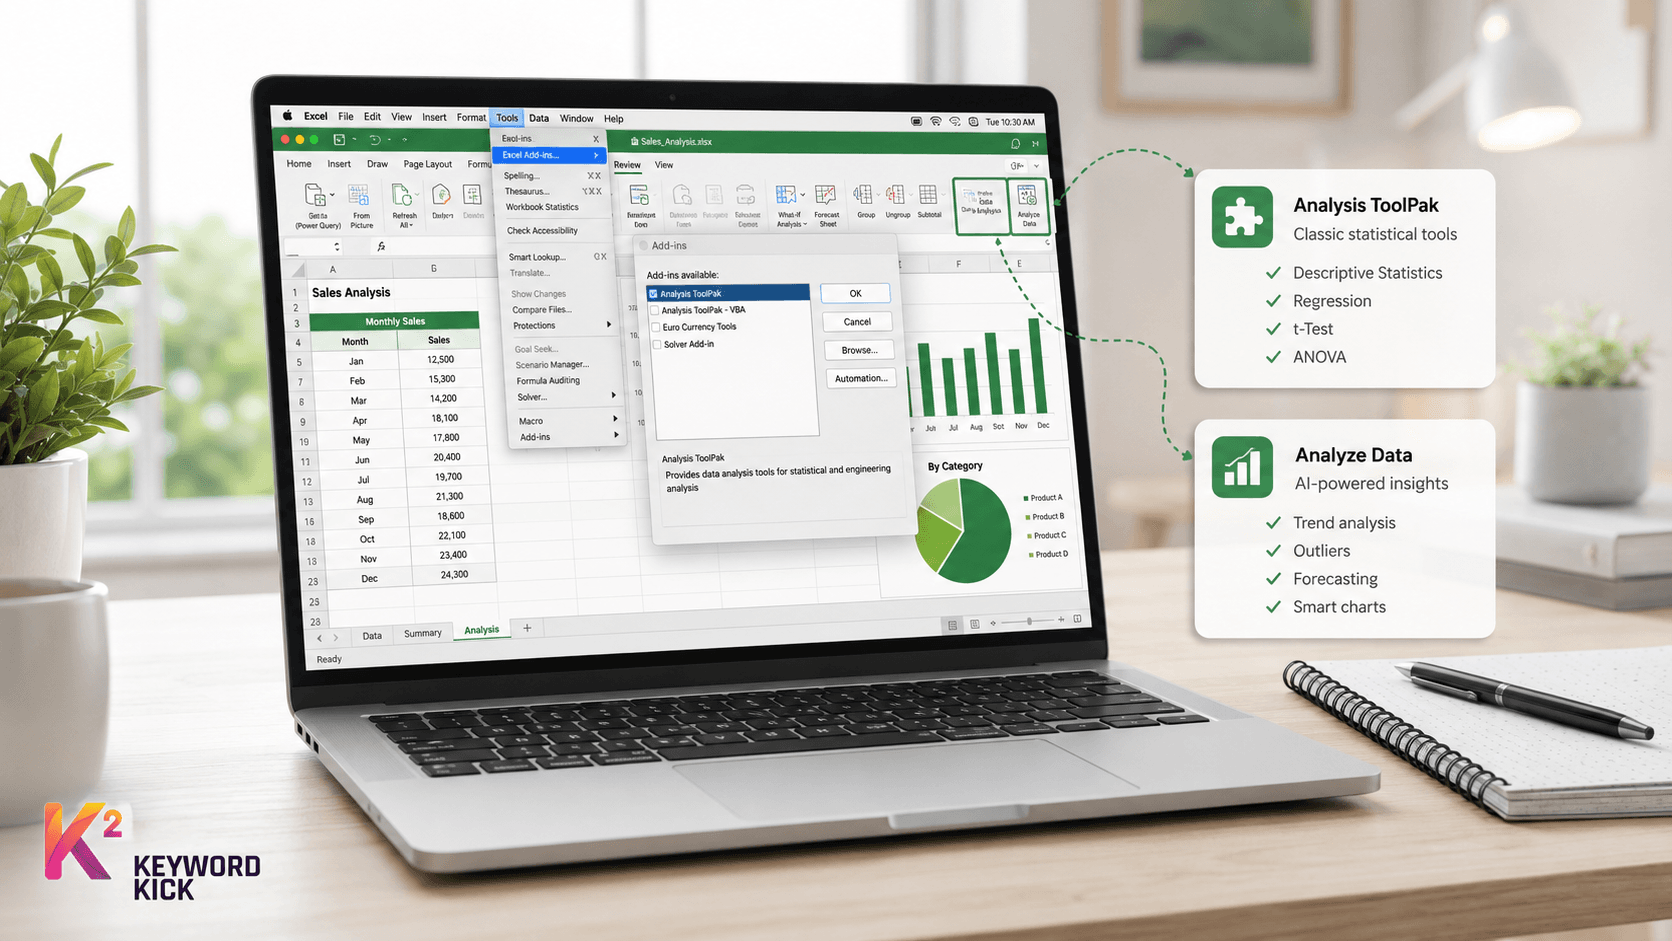
You're sitting in Excel on your Mac, you know the analysis tool is supposed to be there, and the ribbon just won't show the button you expected. Maybe you opened the Data tab and saw nothing useful, or maybe a Windows tutorial told you to click something that doesn't exist on your screen. The fix starts with one simple idea, Excel for Mac has two different Microsoft-built analysis paths, and most confusion comes from mixing them up.
Why Data Analysis Is Hard to Find on Excel for Mac
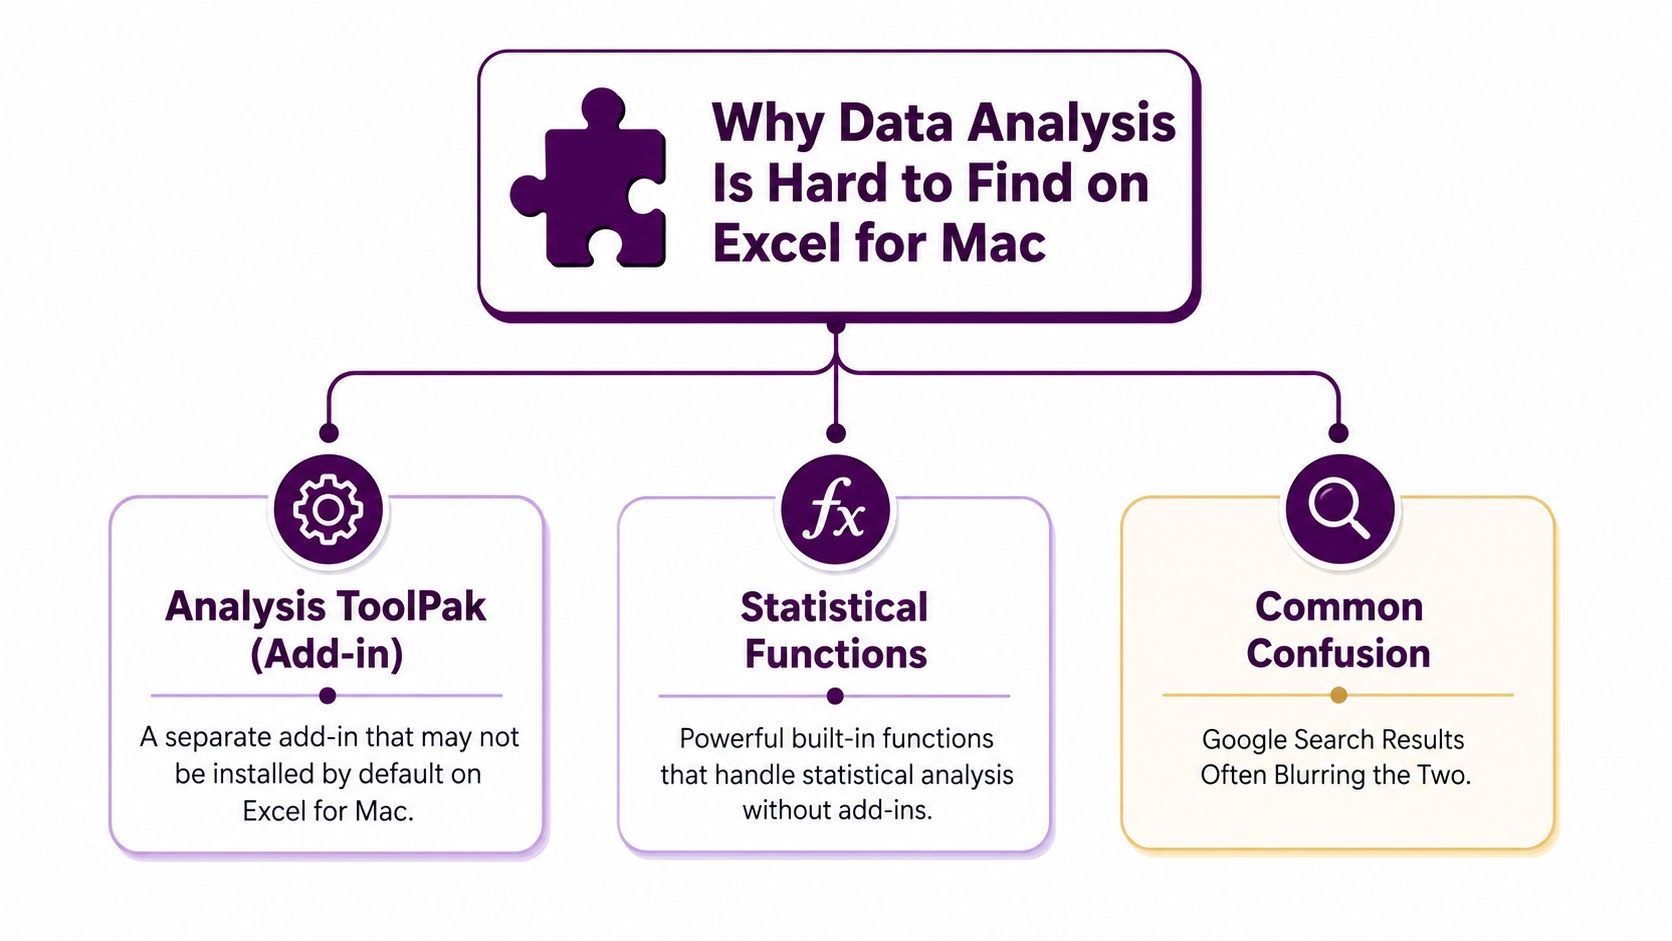
The first trap is that the words sound similar, but the tools are different. Microsoft documents the classic Analysis ToolPak as an add-in loaded through Tools > Excel Add-ins, and once it's enabled, it adds a Data Analysis command on the Data tab. Microsoft also documents a separate Analyze Data feature, which lives on the Home tab instead, so Mac users often look in the wrong place and think the feature is missing when it's just the other Microsoft tool. That split matters because one path is for statistical procedures like regression and ANOVA, while the other is more of an AI-assisted pattern finder. You can see Microsoft's own distinction in its Excel support documentation.
Practical rule: if you want regression, ANOVA, or other statistical procedures, you're looking for the ToolPak. If you want a quick pattern summary, you're probably looking for Analyze Data on the Home tab.
The second trap is that many search results flatten every Mac version into one screenshot-driven flow. That works until you're on a different build, a different menu layout, or an older install that doesn't surface the same buttons. If you've ever wondered why a tutorial seems obvious but your Mac doesn't match it, this is usually why.
For a broader view of why visibility in search and interface discovery can fail in practice, it's worth reading this note on why data visibility is no longer enough. The same lesson applies here, if the right feature isn't in the exact place you expected, the workflow breaks even when the capability still exists.
Enabling the Analysis ToolPak on Microsoft 365
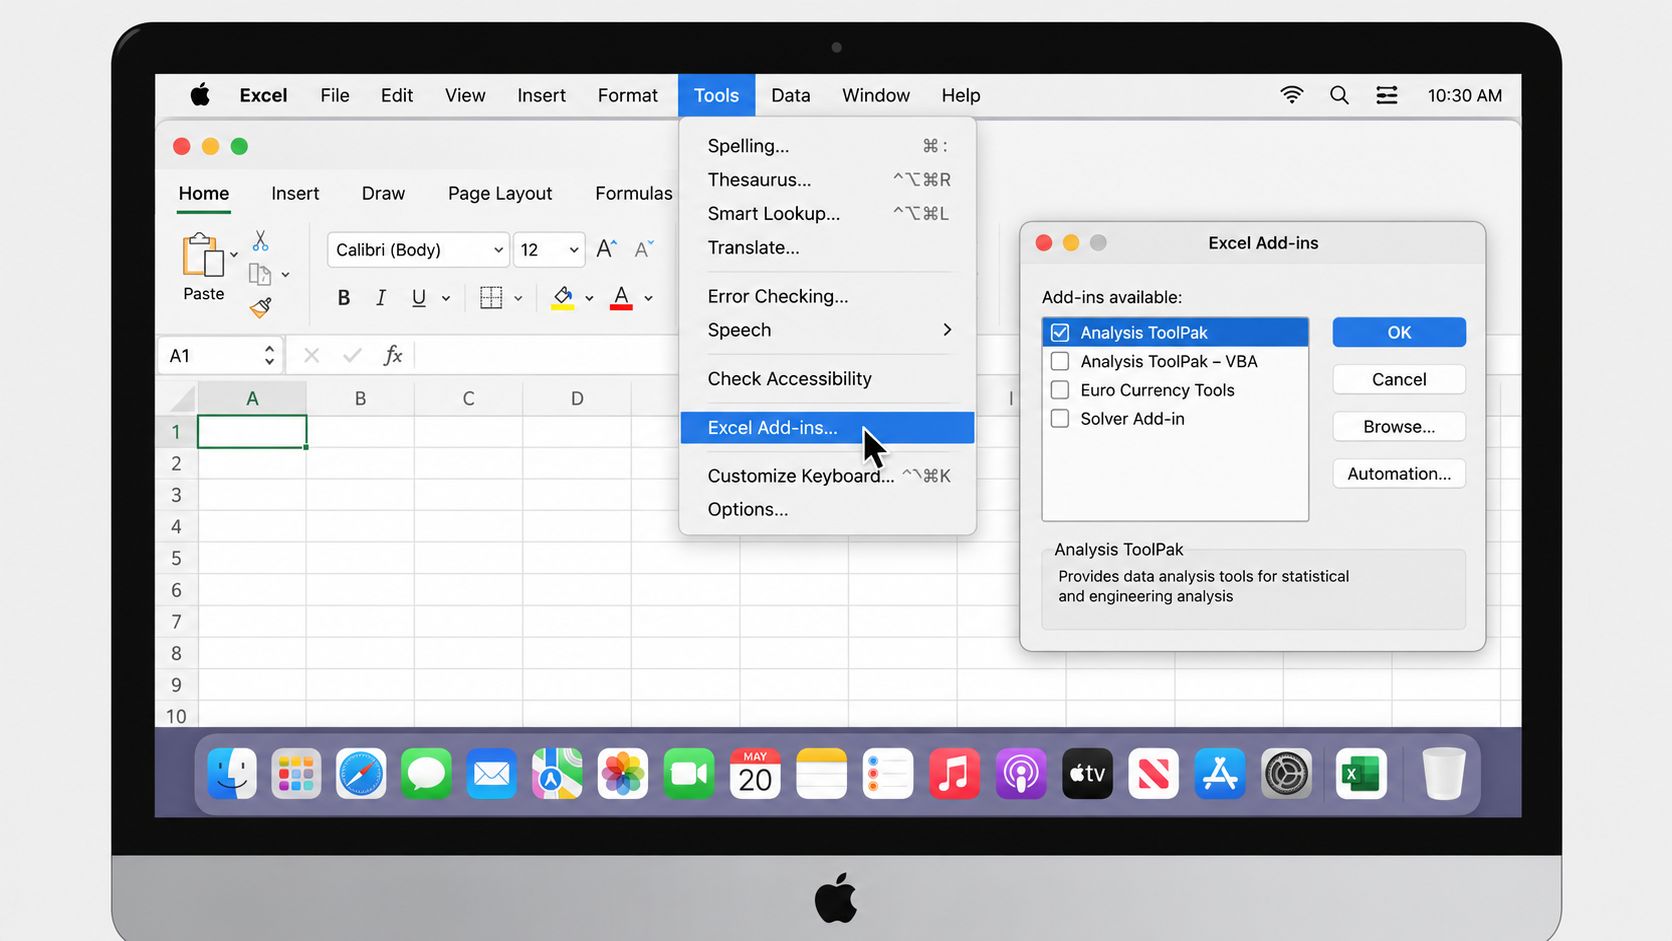
Open Excel on your Mac, then go straight to Tools in the menu bar. Choose Excel Add-ins, check Analysis ToolPak, and click OK. After that, look back at the ribbon and open the Data tab, the Data Analysis button should appear on the right side if the add-in loaded correctly.
If it doesn't show up immediately, close and reopen Excel. That small restart matters more often than people expect, especially after an Office update or the first time the add-in has been activated. Microsoft's workflow and the standard Mac instructions both point to the same core path, Tools > Excel Add-ins > Analysis ToolPak, then the Data tab result you're checking for. A concise Mac-specific walkthrough also notes that the same button lands on the right side of the Data ribbon after activation, which is the fastest visual confirmation that you've done it correctly.
The version detail matters too. On modern Microsoft 365 installs, the native ToolPak workflow appears in Excel 16.83 or later (2023+), while older builds may fail without feedback. If you're helping someone on a shared office Mac, a stale build can make the whole setup look broken even when the user followed every click correctly. In other words, if the button won't appear, don't keep clicking around the ribbon first, confirm the build and then re-check the add-in.
If the ribbon still looks unchanged after you enable it, assume the add-in didn't load fully, not that the tool is gone forever.
Finding Data Analysis on Excel 2016 and Excel 2011
Older Mac installs need their own map. The menu path still starts in Tools, but the labels and layout can feel slightly different depending on whether you're using Excel 2016 or Excel 2011, and many Windows-based guides skip that distinction entirely.
Excel version | Menu path | Button location after enable | Notes |
|---|---|---|---|
Excel 365 on Mac | Tools > Excel Add-ins | Data tab, right side of ribbon | Native ToolPak workflow shows on newer builds |
Excel 2016 on Mac | Tools > Add-ins | Data tab, right side of ribbon | Dialog wording may differ from newer Microsoft 365 installs |
Excel 2011 on Mac | Tools > Add-ins | Data tab after add-in activation | Older menu-bar navigation can feel hidden if Excel is in a different screen mode |
On Excel 2016, the same add-in logic applies, but the dialog wording can read more like Add-Ins than Excel Add-ins. On Excel 2011, the Tools menu is part of the menu bar, so the path feels more old-school and less ribbon-driven. That's where a lot of people get stuck, because they keep looking for a button in the workbook window instead of using the Mac menu bar at the top of the screen.
If the ToolPak entry is missing from the list on an older build, use the Browse option in the add-in dialog and locate the file manually. One Mac-specific guide also warns that the native ToolPak workflow appears only on Excel 16.83 or later, so if you're on an older install, the feature may not surface the way newer tutorials show it.
Before you dig any deeper, check the version number. In Excel, go to Excel > About Excel from the menu bar, then confirm the build number that opens. That two-click check usually tells you whether you should keep troubleshooting the add-in list or stop and update first.
Running Descriptive Statistics in Two Minutes
Once the button is there, the easiest first test is Descriptive Statistics. It's the least intimidating option because you don't need a complex model to see whether the tool works, and it gives you immediate output that's easy to read.
Start with a small table, maybe one column of dates and one column of sales values, or just a single numeric column if you're testing the workflow. Click Data Analysis, choose Descriptive Statistics, and point the Input Range at your numbers. If your first row contains a label, tick Labels in First Row, then check Summary statistics and choose where you want the output to land. The ToolPak will return common summary fields such as the mean, median, standard error, and range, which gives you a quick sense of whether your data is behaving normally or has obvious outliers.

When you see the output table populate, that's your proof the add-in is live. If the dialog closes but nothing appears, you probably sent the results to a blank location you weren't viewing, or the input range wasn't selected correctly. For a practical use case outside pure statistics, the same habit of summarising a column first is useful when you're tracking SEO work, and you can pair that with a practical guide to measuring SEO performance when you want to structure the workbook around reporting rather than raw data.
Running a Linear Regression the Same Way
Regression uses the same Data Analysis dialog, so you're not learning a new interface, just a new model. The main difference is that you now need to define an outcome column and an explanatory column, and Excel needs those ranges lined up the right way.
Choose Regression from the dialog, then set the Input Y Range to the dependent variable and the Input X Range to the predictor. If your first row includes headers, check Labels so Excel treats them as names instead of numbers. Then choose an output location or let Excel place the results on a new worksheet.
The most common beginner mistake is simple, but it's easy to miss. People select the X values as a row when the data is stored in a column, or they include the wrong cells because the table headers are off by one. If Excel throws an error or the output looks nonsensical, check whether the X and Y ranges point to vertical columns with matching lengths.
Useful check: if your table has one row per record, your regression inputs should usually be columns, not rows.
The output is where the tool earns its keep. Look at the ANOVA table for the model overview and the coefficients block to see how each variable contributes. You don't need to interpret every number on day one, but you do need to recognize the structure so you can tell a valid run from a broken one.
Troubleshooting When Data Analysis Stays Missing
If the button still isn't there, start with the obvious problem first, the add-in may have been unchecked after an update. Go back to Tools > Excel Add-ins and confirm Analysis ToolPak is still ticked, because Office updates can reset add-ins and make a previously working setup look broken again. If the file is missing from the list, use Browse inside the add-ins dialog and point Excel to the add-in file manually.
The next thing to verify is the build. The ToolPak workflow on Mac appears only in Excel 16.83 or later (2023+), so older versions may fail without any visible error even when the menus look normal. If you're on a managed work Mac, that's the first clue that you may be waiting on a company update rather than missing a setting. Also, if Excel is in full-screen mode, the Tools menu can feel harder to reach, which is a very Mac-specific reason people think the option vanished.
Corporate devices add one more wrinkle, since admin policies can block add-ins entirely. If your workbook is on a managed machine and the add-in list refuses to behave, ask IT whether Excel add-ins are restricted by policy. That's often faster than clicking through the ribbon for half an hour.
If you're comparing careers and wondering why spreadsheet skills keep showing up in analytics roles, browse careers for analytical minds is a useful reminder that a lot of roles still rely on exactly this kind of Excel fluency. The people who do well with this work usually don't just memorize menu paths, they learn how to diagnose the interface when it behaves differently than expected.
When the ToolPak Is Not Enough and What to Use Next
The ToolPak is good at classic statistical work, but it isn't the answer to every question. If you want richer dashboards, repeatable automation, or heavier data cleaning, a third-party statistics add-in can make sense, especially if you need features beyond the built-in menu. In those cases, tools such as XLSTAT or the Real Statistics Resource Pack are common alternatives, while Analyze Data on the Home tab is better when you just want a quick pattern check without setting up a formal test.
Sometimes the right move is to stop forcing Excel to do everything. If your workflow is really about scripting, reproducibility, or larger modeling tasks, moving the analysis to R, Python, or even Google Sheets can be a cleaner fit. For keyword work in particular, Excel is still handy for organizing rows, removing duplicates, and comparing sets, and this guide to tracking keyword rankings without spreadsheets is a useful reminder that not every SEO process belongs in a worksheet forever.
If you're trying to decide whether the problem is Excel or the way the workbook is set up, run this four-point check before you blame the feature itself. Confirm the Excel build, confirm the Tools menu is visible, confirm Analysis ToolPak is checked in Add-ins, and confirm the Data Analysis button appears on the Data tab. If all four are true and you still can't get the result you want, the issue isn't finding the tool anymore, it's choosing the right tool.
For anyone comparing analytics pathways more broadly, JAIN Online's complete guide to data science degrees gives useful context on how spreadsheet skills sit alongside deeper quantitative training. That's the split, Excel helps you move quickly, but a dedicated analytics stack helps when the work outgrows the ribbon.
Keyword Kick helps teams turn messy search and spreadsheet data into clear next steps, which is useful when you're trying to organise keyword lists, rankings, or reporting in Excel for Mac. If you want an SEO workspace that connects rank tracking, GA4, Search Console, and technical data in one place, visit Keyword Kick and see how it fits into your workflow.