
The most popular advice about SEO reporting is to put rankings, organic traffic, and completed tasks into a dashboard. That produces a status update, not a useful report. A marketing team still needs to know which pages changed, what probably caused the movement, and what someone should do next.
Learning how to do SEO reporting means building a decision system. Each KPI needs a definition, source, and owner. Each meaningful decline needs an investigation that reaches a page, a query or query group, and a next action, even when the honest conclusion is that the cause remains uncertain.
The KPIs Every SEO Report Needs
The trap is listing rankings and sessions, then stopping before anyone learns what to do. Separate exposure, visits, and business value so a strong result at one stage doesn't conceal a problem at another.
Google's Search Console Performance documentation defines impressions, clicks, CTR, and average position; using its CTR formula, 50 clicks divided by 1,000 impressions equals 5%. Average position describes the average position of your topmost result for each impression, not a precise rank that every searcher sees.
Core SEO report KPIs and what each answers
| KPI | Definition or formula | Source | Question it answers |
|---|---|---|---|
| Impressions | Times your page appeared in search results | Search Console | How much exposure do you have? |
| Clicks | Clicks generated by selecting your result | Search Console | How much search traffic do you earn? |
| CTR | Clicks divided by impressions | Search Console | How effectively does your result earn the click? |
| Average position | Average rank of your topmost result per impression | Search Console | What's the ranking context, rather than a precise keyword rank? |
| Organic sessions | Visits attributed to organic search | GA4 | How much traffic reached the site? |
| Engaged sessions | Sessions meeting GA4's configured engagement criteria through duration, page views, or a key event | GA4 | Did visitors meet the engagement criteria? |
| Key events | Important actions you define, such as lead submissions or purchases | GA4 | Which tracked business outcomes did organic visitors complete? |
| Revenue per organic session | Organic revenue divided by organic sessions | GA4 | Is organic traffic becoming more valuable? |
Read the relationships, not just the arrows
Rising impressions with falling CTR can mean broader visibility with weaker search-result appeal. It can also mean you've started appearing for a different query mix. Check the affected queries before rewriting titles across the site.
Likewise, fewer clicks with stable average position doesn't automatically mean the report is wrong. Demand, device mix, or the searches generating impressions may have changed. Show period-over-period movement alongside the pages and queries responsible.
Keep property-level and page-level reporting separate. Search Console aggregates them differently when multiple URLs appear, so switching dimensions can change totals and CTR. Record the reporting scope instead of assuming every export is comparable.
Give each KPI an operating rule
For teams choosing their reporting shortlist, Wispra's guide to measuring success with SEO metrics provides a useful companion to a metric dictionary. The practical test is whether each selected metric informs a decision.
Before exporting anything, document:
- Definition and denominator: State exactly what's counted and how rates are calculated.
- Source and scope: Name the property, channel filter, and reporting dimension.
- Owner: Assign someone who can validate the metric and investigate changes.
- Action threshold: Define what warrants investigation, using the page's normal variability and business importance.
Practical rule: If nobody can explain what they'd do when a KPI deteriorates, it probably belongs in the appendix rather than the executive summary.
Connecting Search Console, GA4 and Rank Data
Choose sources by the questions they can answer, not by how easily their charts fit together.
Which data source answers which question
| Data source | What it measures | Best used for | Known limit |
|---|---|---|---|
| Search Console | Impressions, clicks, CTR, and position before the visit | Query and page demand, snippet performance | No onsite behaviour or conversions |
| GA4 | Organic sessions, engaged sessions, key events, and revenue after arrival | Business outcomes from organic search | Totals won't match Search Console one-for-one |
| Rank tracker | Daily positions by keyword, location, and device | Specific commercial keywords and SERP features | Only covers the keywords and markets selected |
| Site audit crawler | Technical issues assessed for SEO impact | Investigating errors that might explain declines | A snapshot that needs recurring runs |
Search Console measures search activity before arrival. GA4 measures activity on the website. Clicks and sessions aren't interchangeable, so reconcile material differences in writing rather than manipulating filters until the totals match.
When you combine search and analytics data, compare a shared landing-page and date scope while preserving each metric's source label. If measurement isn't established yet, MD TECH TEAM's introduction to website analytics for small businesses is a useful setup resource before building the reporting layer.
Add ranking context without overstating coverage
Track a focused set of commercial terms, including their target market and device. A ranking chart for selected keywords isn't a complete measure of search visibility.
Our rank-tracking setup involves entering the keywords to monitor, choosing target search engines, and specifying the geographic locations that matter to the business. Setup takes less than two minutes. Choose those inputs deliberately, because they define what the resulting report can tell you.
State how conversion credit is assigned
GA4's attribution documentation defines an attribution model as a rule or algorithm assigning credit across touchpoints and notes that first-click, linear, time-decay, and position-based models were removed in November 2023. Name the model used rather than copying an old reporting template.
Document the lookback window, consent limitations, reporting scope, and whether revenue is gross or net. Don't present last-click organic conversions as SEO's total contribution; inspect conversion paths for organic interactions that helped earlier in the journey.
The monthly validation pass should include:
- Event integrity: Check duplicate firing and unexpected changes in key-event counts.
- Landing-page alignment: Compare organic landing pages with the corresponding search-click trends.
- Outcome calculation: Calculate session key-event rate and revenue per organic session with clearly labelled denominators.
How to Build the Report in Seven Steps
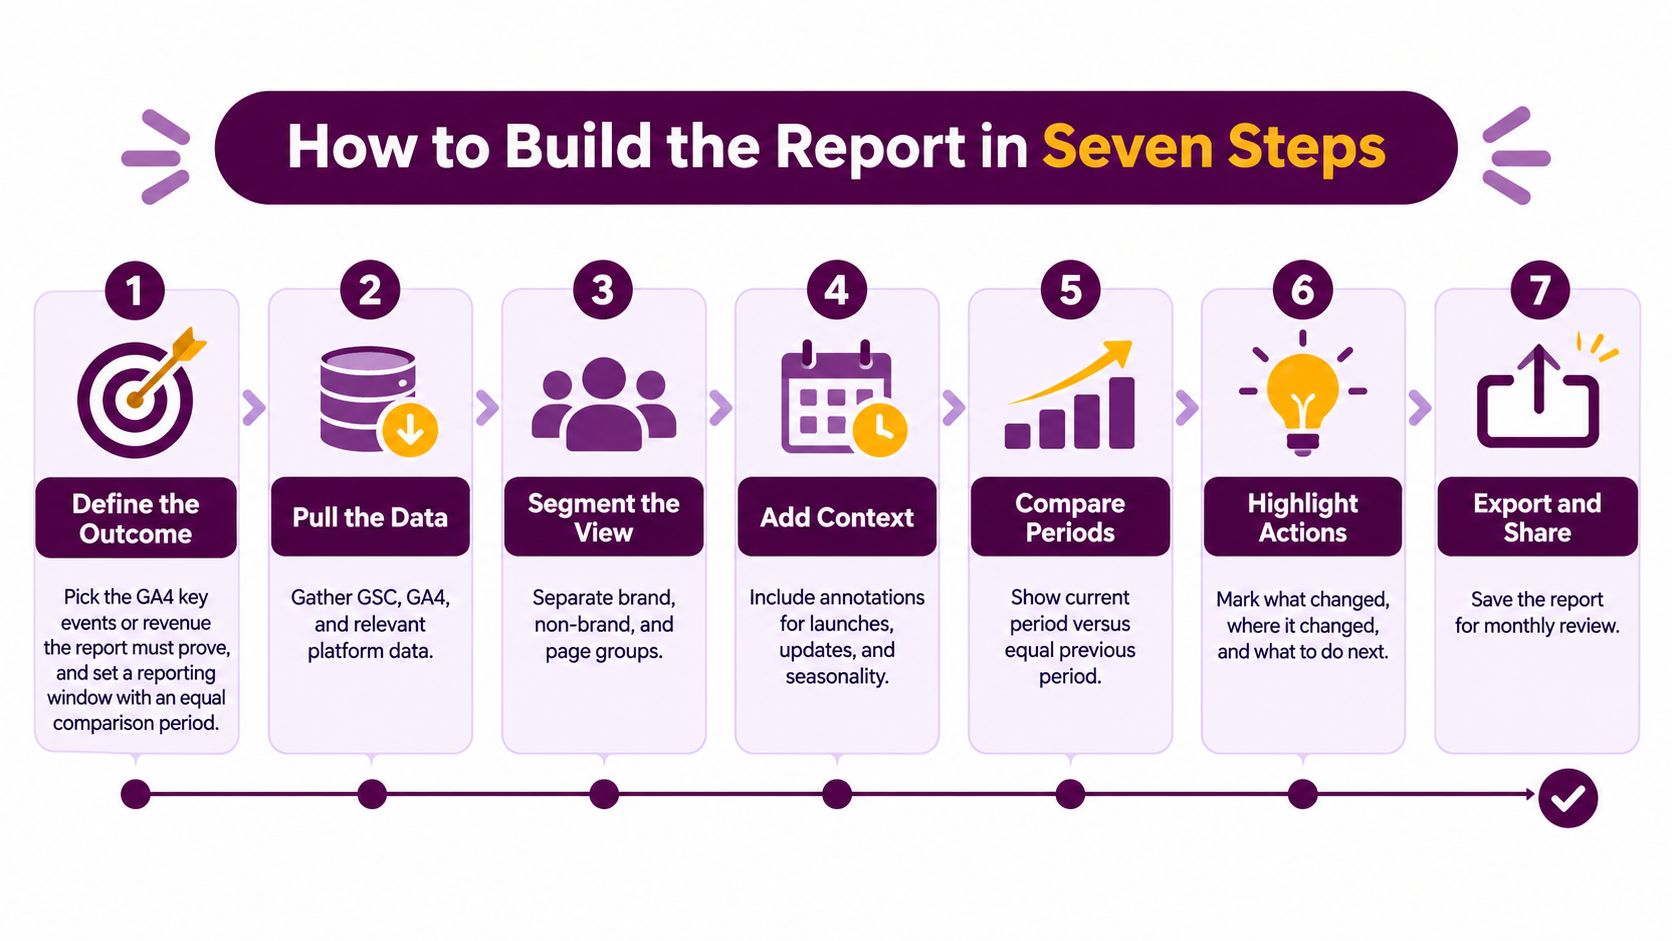
Use the same production sequence each month. Consistency makes it easier to distinguish a real performance change from a changed filter, broken join, or revised definition.
Prepare the evidence
Define the outcome and comparison. Pick the GA4 key events or revenue measure the report must evaluate, then set a complete reporting window and an equivalent comparison period. Match weekday composition where practical and flag seasonality, rather than treating any previous period as a fair baseline.
Export the search data. Pull Search Console views by date, page, query, country, and device, retaining the filters used for each export. Keep page-level and query-level datasets distinct, because forcing every dimension into a single table can obscure aggregation differences and omissions.
Segment the audience and landing pages. Separate branded from non-branded queries, commercial from informational intent, and priority page groups from the rest of the site. Maintain a documented classification rule, including brand misspellings and ambiguous queries, so next month's comparison doesn't change because someone labelled terms differently.
Calculate the search metrics together. Review clicks, impressions, CTR, and average position side by side for each relevant segment. Recalculate aggregate CTR from total clicks divided by total impressions, and don't manufacture a universal ranking KPI by averaging keyword positions.
Connect the evidence to the deliverable
Join at the landing-page level. Map Search Console pages to GA4 organic landing pages and compare sessions, engaged sessions, key events, and revenue where available. Normalise URL formats carefully, preserve meaningful page distinctions, and don't imply that a page-level join reveals which individual query generated a conversion.
Annotate changes on a shared timeline. Record content launches, title edits, migrations, tracking changes, and relevant algorithm releases with their dates and affected URLs. An annotation is a possible explanation to investigate, not proof that the recorded event caused the movement.
Assemble the decision package. Produce a concise executive summary, a ranked opportunity table, and a measurement appendix. Include filters, date ranges, data freshness, known exclusions, and unresolved measurement issues so another analyst can reproduce the result.
A repeatable report should survive a change of analyst. If someone else can't reproduce the result, the process needs clearer rules.
Keep a saved copy of the underlying exports alongside the final report. Live dashboards can change as source data updates or field definitions change, while the team still needs to know what evidence supported the original decision.
Before distribution, inspect the joins for duplicated rows and missing pages. A landing page repeated across query rows can multiply GA4 outcomes if you sum the joined table carelessly. Check source totals against the final output, then investigate discrepancies rather than rounding them away.
Visualizing and Automating the Monthly Report
A useful dashboard makes unusual movement easy to find. It shouldn't require a stakeholder to interpret a crowded chart with unrelated scales.
Use a fixed visual layout, but let the commentary change with the evidence. The recurring elements should include:
- Trend panels: Separate weekly lines for clicks, impressions, CTR, and position, with consistent scales within each metric.
- Demand split: Paired bars showing branded and non-branded performance.
- Page movement table: Landing pages sorted by absolute click change, with business outcomes alongside them.
- Annotation layer: Visible markers for releases, migrations, content changes, and measurement edits.
Automate collection, not judgement
Schedule Search Console and GA4 extraction on the same reporting cadence. Store the outputs in a shared dataset, and save the URL mapping and join logic as a reusable query rather than rebuilding them in a spreadsheet.
Add validation checks before refreshing the presentation. Flag missing exports, unexpected date coverage, duplicated landing pages, and abrupt event-count changes. If validation fails, label the report incomplete instead of delivering a polished but misleading summary.
When choosing an SEO reporting tool, prioritise source transparency, stable definitions, and reusable templates over decorative widgets. You need to inspect why a number changed, not just change its colour.
Keep the template stable and the analysis current
Reserve fixed slots for the executive summary, opportunity table, and appendix. Populate reporting dates, filters, freshness, and exclusions automatically where possible, leaving the analyst to write the interpretation.
Set alerts around meaningful deviations from each page group's normal behaviour. Require enough traffic for a movement to matter, and route alerts to someone responsible for investigating them.
Review the template periodically and log changes to field definitions. Automation should remove repeated assembly work, while people still check whether the recommended action fits the business.
Diagnosing Why Performance Changed
Start with the pattern, then narrow it to the affected page and queries. If impressions fall while position holds, investigate demand and eligibility before changing content. If impressions hold but CTR falls, inspect the search result; if clicks hold but conversions fall, investigate the post-click experience.
Google's guide to analysing Search performance provides the basis for examining changes through queries, pages, and performance metrics. Use those views to test explanations rather than assigning every decline to an algorithm update.
Symptoms, likely causes and first checks
| Symptom | Likely cause | First check |
|---|---|---|
| Impressions fall, position holds | Lost demand, indexing, or eligibility problem | Page indexing report and query trend by page |
| Impressions hold, CTR falls | Weaker snippet, new SERP feature, or intent shift | Compare titles and SERP features for top queries |
| Clicks hold, conversions fall | Landing-page, tracking, or traffic-quality problem | Check key-event firing and the page change log |
| One page drops, others hold | Cannibalization or a recent content change | Query-level view of competing URLs |
Test the most specific explanation first
Say a product guide loses clicks while impressions remain steady. The team changed its title shortly before the decline, making that edit a reasonable first suspect, not a confirmed cause.
Check whether CTR declined for the same query group, country, and device. Inspect the displayed title and competing results, then look for changes in query mix. If the decline is confined to newly appearing informational queries, reversing the title may solve nothing.
In another scenario, a non-brand guide retains a similar position but attracts fewer clicks after a competitor gains a featured snippet. Compare the SERP layout for the affected query before commissioning a full rewrite. The relevant intervention may be improving a concise answer section rather than expanding the article.
Gather evidence that can disprove your theory
For repeatable observations of competitor pages and search-result changes, teams can explore SEO monitoring data solutions from WebscrapingHQ. Define the queries, locations, devices, and collection method first so the comparison reflects consistent conditions.
Then validate the anomaly against GA4 organic sessions, engaged sessions, key events, and revenue. Check the annotation timeline for releases or migrations in the same window, and inspect tracking before interpreting a conversion decline as lost demand.
Diagnosis standard: A plausible explanation belongs in the report as a hypothesis until the evidence supports it. Timing alone isn't causation.
Finish the investigation with an action proportional to the evidence. A broken form warrants immediate repair; an uncertain snippet hypothesis warrants a controlled change and a review date. If the evidence is inconclusive, assign the next check rather than inventing certainty.
Measuring AI Answer and Zero-Click Visibility
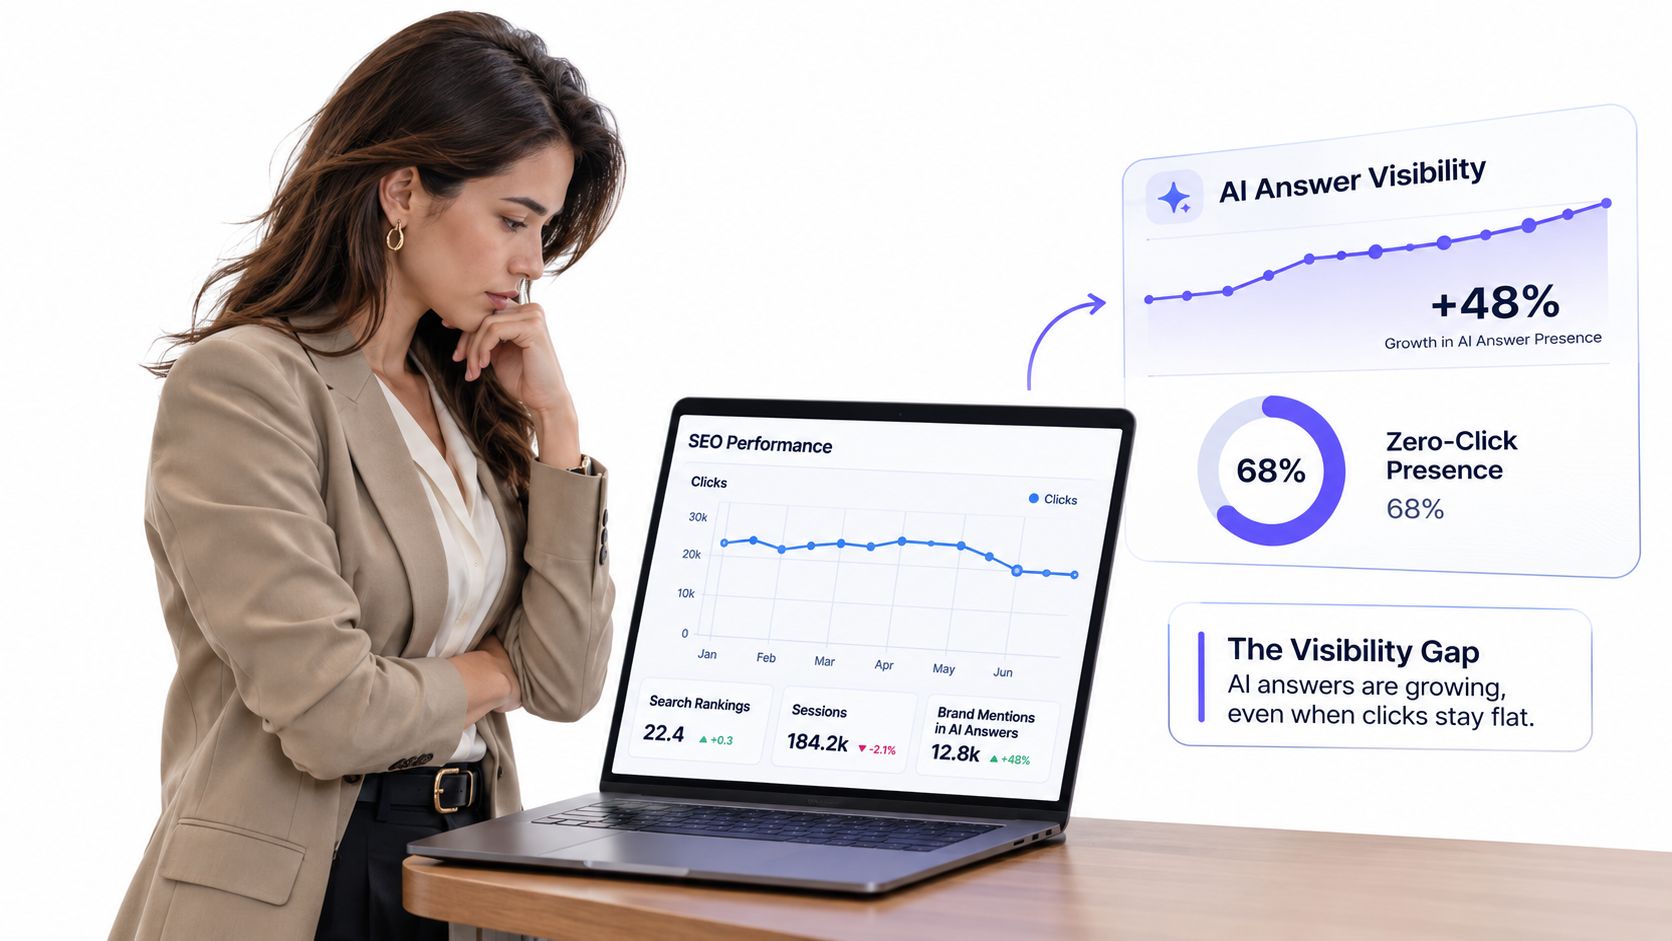
Clicks don't tell the full visibility story when people can read an answer without visiting your site. But a brand mention inside an AI answer isn't automatically a substitute for qualified traffic.
PushLeads' industry report on AI search says Similarweb recorded 1.13 billion visits from AI platforms in June 2025, up 357% year over year. Those are reported industry figures, not a forecast for your site or a benchmark your reporting should promise to match.
Build a reproducible observation set
Choose a manageable, fixed sample of commercially relevant prompts and informational queries. Record the platform, observation date, geography, and device or interface, then repeat the same method each reporting period.
Keep distinct fields for:
- Answer presence: Did an AI-generated answer appear?
- Brand mention: Was your business named, and in what context?
- Citation and link: Which URL was cited, and was it clickable?
- Sentiment: Was the description positive, neutral, negative, or misleading?
- Outcome evidence: Did identifiable referrals or assisted conversion paths follow?
Don't combine these observations into an unexplained visibility score. A linked citation, an unlinked mention, and an answer extracted from your content represent different outcomes.
Validate visibility against demand
Treat AI-answer presence as an upper-funnel signal, not the replacement for revenue or qualified leads. Compare it with branded search, direct traffic, referral evidence, and assisted conversions, while recognising that parallel movement doesn't prove a causal relationship.
If branded demand and direct visits hold while non-brand clicks fall, answer extraction is a possibility to investigate. It isn't enough to declare that the missing visits were harmless. Check the actual answer, the cited page, search demand, and any changes to business outcomes.
Use these search visibility insights from Keyword Kick to frame the visibility question, then keep AI observations beside conventional search performance rather than blending unlike measures.
Presenting Findings So Stakeholders Act
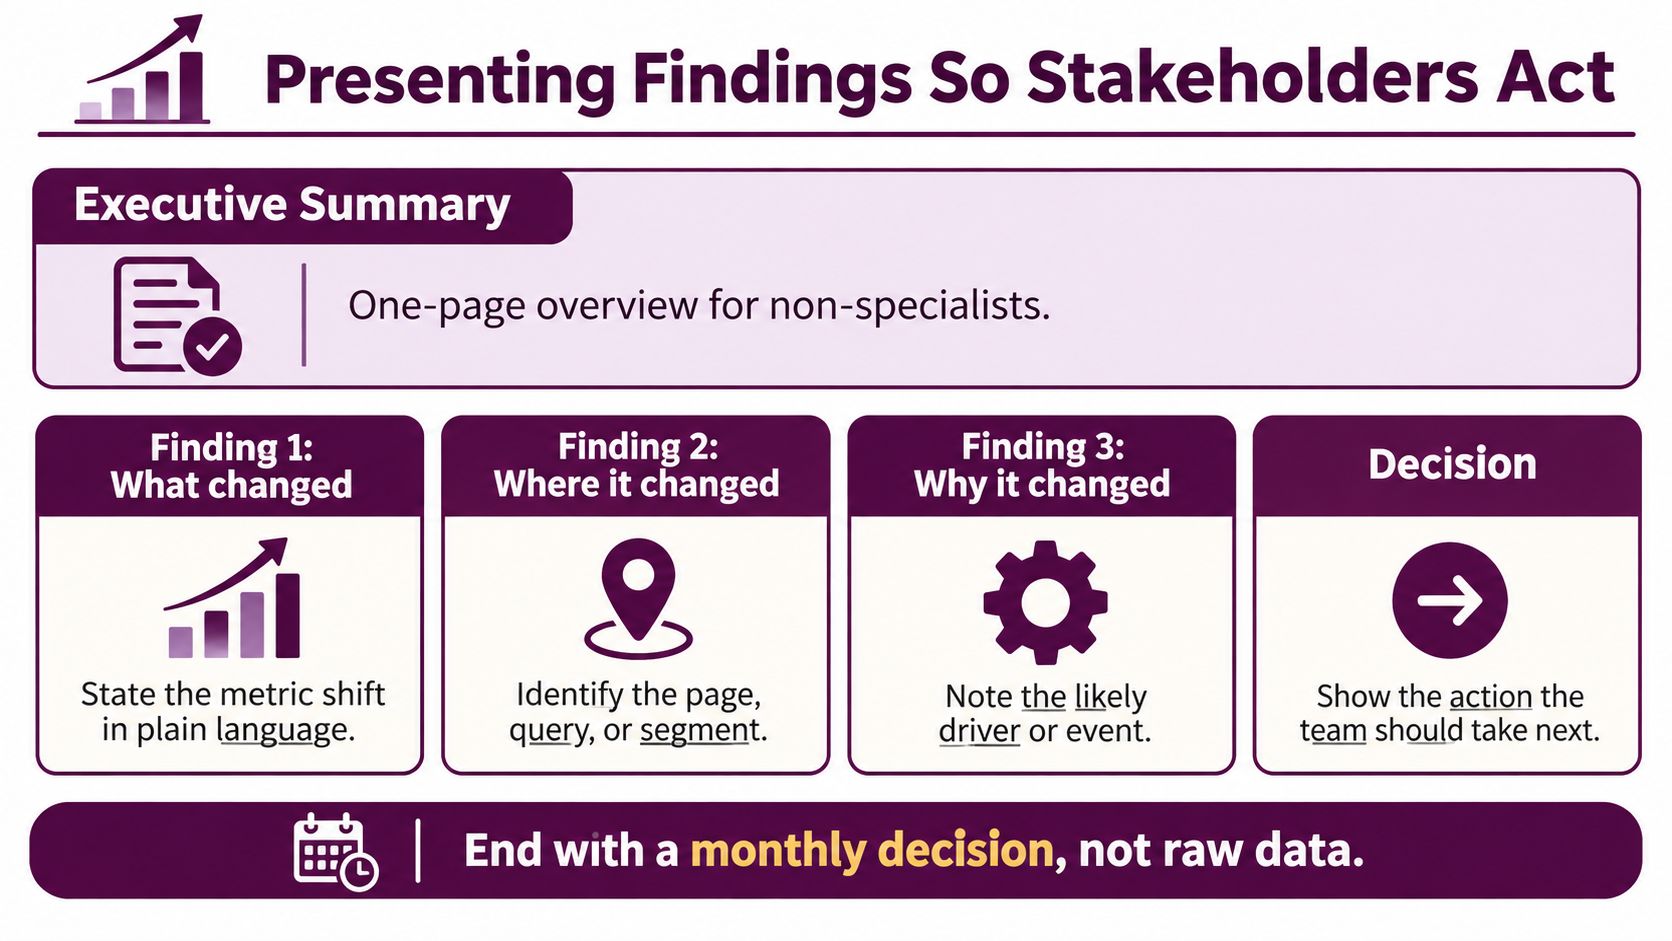
Lead with the decision the team needs to make, not a tour of the dashboard. A non-specialist should be able to identify the affected business outcome and the proposed response without learning every SEO metric.
A small-business discussion about reporting SEO work illustrates the practical demand for specific pages, changed metrics, and meaningful next steps. Treat that as a useful practitioner question, not evidence of how all businesses evaluate SEO.
Write findings that can become assignments
Start with a one-page executive summary containing only the findings that require attention. Give each finding the same decision-ready ingredients:
- What and where: Identify the metric movement, landing page, query group, device, or market.
- Likely cause: State the leading explanation and the evidence against alternatives.
- Business effect: Connect the movement to key events, qualified demand, or revenue.
- Measurement context: Label the source, comparison period, attribution window, and confidence.
- Next action: Name an owner, a due date, and the signal to review afterward.
A hypothetical finding might read:
Finding: Organic revenue increased on priority category pages against the comparison period. Confidence: Medium, because a tracking revision occurred during the reporting window. Decision: The analytics lead will reconcile the event change before the content team expands the optimisation approach.
That wording separates a measured movement from an uncertain interpretation. It also prevents the team from scaling work on the strength of an unreliable comparison.
Rank opportunities by business value and effort
Follow the summary with an opportunity table containing the page or query group, proposed intervention, expected incremental outcome, effort, confidence, owner, and review date. Label forecasts as estimates and state the assumption behind them, such as recoverable CTR or an observed landing-page conversion rate.
A lower-traffic month can still represent progress if more visitors reach high-intent pages and generate qualified demand. Conversely, an informational ranking gain may have little immediate commercial value when the page offers no useful next step.
Our agency reporting process supports professional site health reports that communicate technical issues and their business impact. Translate each audit item into affected URLs, the likely user or search consequence, and the work required to resolve it.
If a slide can't name a decision, next action, or material uncertainty, cut it.
Build Your First Report This Week
Build a small, defensible report before attempting a detailed dashboard. Choose a focused KPI set, establish a complete reporting window and equivalent comparison, and export Search Console page and query data for the reporting month.
Join the page view to GA4 organic landing pages, then investigate the largest meaningful movement. Book the monthly review before distributing the report so the findings have a place to become assignments.

Run the starter checklist
- Outcome defined: Identify the GA4 key event or revenue measure the report evaluates.
- Measurement documented: Record sources, scope, attribution model, and comparison dates.
- Segments applied: Separate branded and non-branded demand, plus the priority page groups.
- Largest movement investigated: Run the diagnosis checks and record what remains uncertain.
- Summary ready: Give every recommended action a named owner and a due date.
Don't delay distribution because the report lacks an elaborate design. A clear finding backed by reproducible evidence is more useful than another chart added without a decision attached.
Before the week ends, save the extraction logic and schedule the next run. The next question is operational: can the same report arrive each month without someone rebuilding it by hand?
Keyword Kick brings search and analytics signals into a shared workspace and supports scheduled, branded SEO reporting. Visit Keyword Kick to start building your reporting workflow; our support team can help you set up your account, connect Google Search Console, configure rank tracking campaigns, and understand your SEO analytics.