
74.79% of businesses identified increased website traffic as a key indicator of content marketing and SEO success in a 2024 survey of more than 140 businesses, according to Databox. Traffic deserves a place in the report, but it doesn't tell a team whether to fix indexing, rewrite a category page, investigate tracking, or leave a successful page alone.
SEO analytics and reporting should produce a diagnosis, not just a trend chart. Separate every finding into what the data shows, what might explain it, and what the team should do. Keep those statements distinct, and stakeholders can judge the recommendation without mistaking a plausible explanation for a proven cause.
The Core SEO Metrics and Where Each Comes From
Start with a metric set that connects discovery to business value. Search Console answers questions about Google Search exposure, GA4 describes measured activity after arrival, and your CRM or ecommerce platform records the commercial outcome.
Core SEO metrics by source
| Metric | Source | What It Tells You |
|---|---|---|
| Impressions | Search Console | How often your pages appeared in search results |
| Clicks | Search Console | Traffic earned from search results, not an equivalent count of analytics sessions |
| Click-through rate | Search Console | Share of impressions that turned into clicks |
| Average position | Search Console | Average reported position across included searches; a visibility signal, not a business result |
| Engaged sessions | GA4 | Organic sessions that met GA4's engagement criteria |
| Key events | GA4 | Selected important actions completed by measured visitors |
| Organic revenue or pipeline | CRM or ecommerce platform | Business value tied to organic interactions, labeled with its attribution model |
| Keyword positions | Rank tracker | Daily movement on tracked keywords by location and device |
| Referring domains | Backlink tool | Growth and relevance of websites linking to you |
| Indexed pages and errors | Search Console | Whether intended pages are indexed and what may prevent indexing |
| Crawl and technical issues | Site audit tool | Broken links, redirect chains, crawl errors, and structural problems |
Give each source a specific job
Use Search Console to investigate queries, pages, and search exposure. Keep query intent visible in the analysis: an impression for a broad informational question doesn't represent the same opportunity as an impression for a product comparison.
Use GA4 to examine landing-page behavior and configured key events. Google's GA4 overview describes event-based measurement across websites and applications, which makes event definitions part of your reporting method, not a technical footnote. A purchase, a submitted inquiry, and a downloaded guide should remain distinguishable.
Rank trackers, backlink tools, and crawlers supply investigative context. Configure the tracker for your actual markets, inspect referring domains for relevance rather than count alone, and use crawl findings to identify URLs that need verification. A crawl warning isn't automatically the reason a page lost traffic.
Pair visibility with behavior and outcomes
Average position isn't a business result. An aggregate can change when the underlying query mix changes, so inspect the relevant query group before interpreting movement as a competitive gain or loss.
For each page group, pair a visibility measure with a behavior measure and an outcome measure. A category report might combine search clicks, engaged sessions, and attributed sales; an editorial report might combine qualified-query impressions, relevant key events, and CRM-qualified leads.
For a practical editorial measurement reference, TheContentMap explains how to track results across published content. Use that approach to keep individual articles accountable to their intended purpose rather than judging every page by traffic alone.
Choose a compact set of metrics that matches the stated goal before building charts. Keep supporting diagnostics available, but don't make stakeholders interpret every available field.
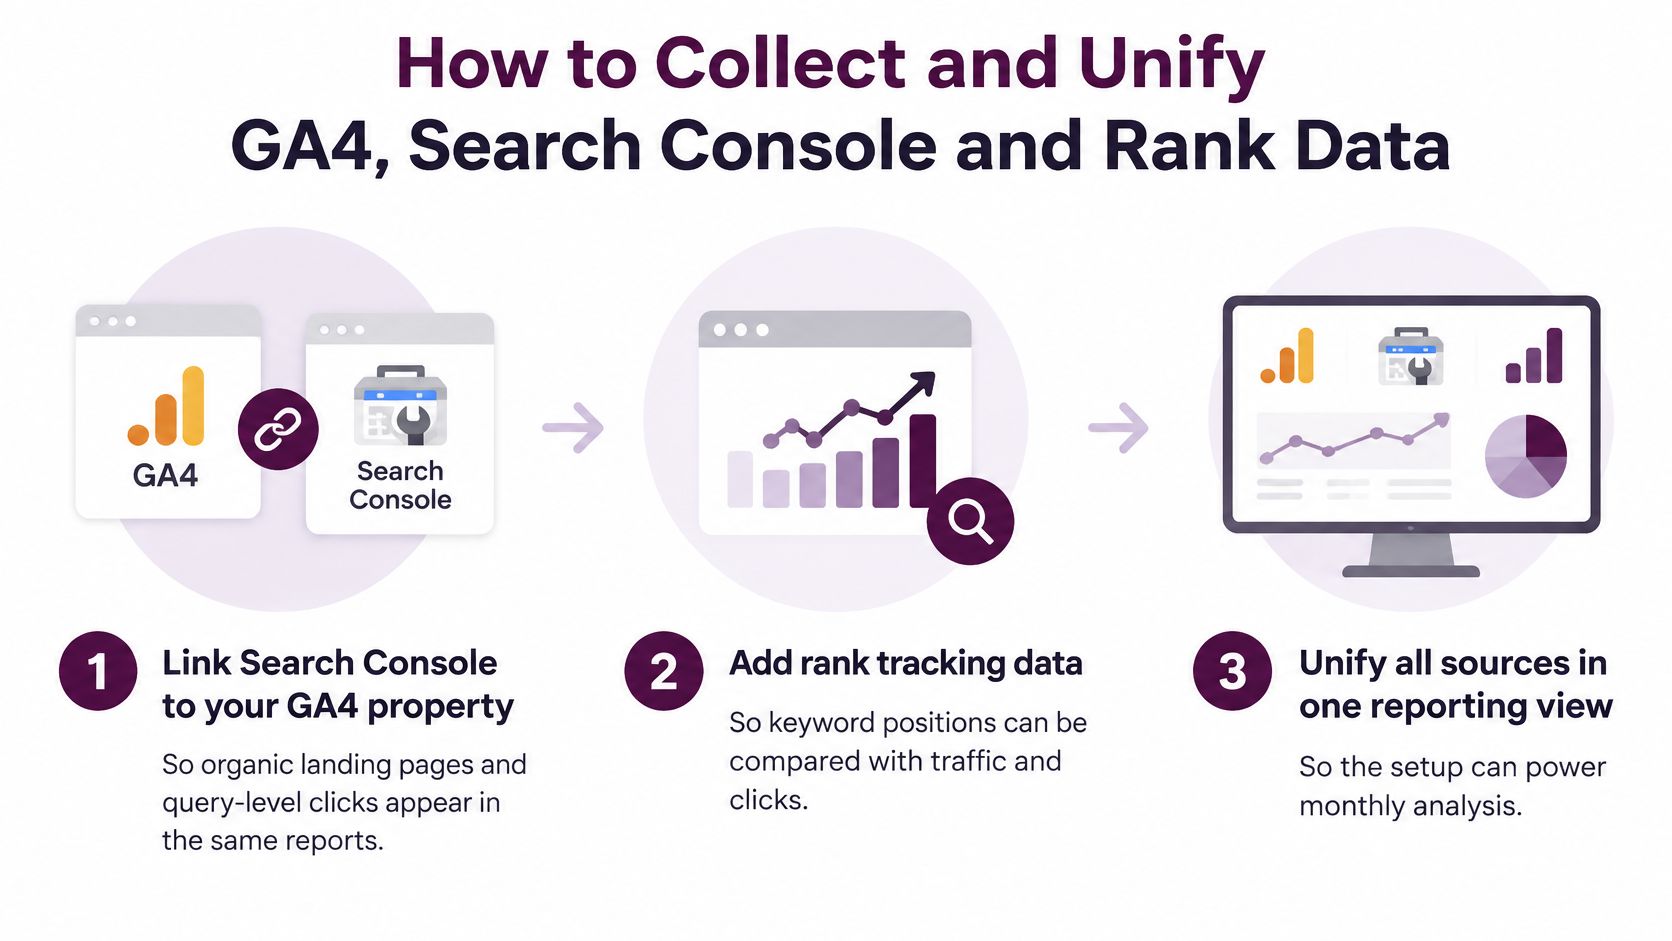
How to Collect and Unify GA4, Search Console and Rank Data
A shared dashboard doesn't make different sources interchangeable. Build a pipeline that preserves each metric's origin, records extraction details, and joins datasets only at a compatible level. Every stored extract should let a future analyst separate what the number shows, what produced it, and what the team should check next.
Establish a repeatable collection routine
Connect the correct properties. Follow the setup to link Search Console to GA4, checking that both properties cover the intended website. Use the integrated landing-page and query reports as complementary views rather than as a query-level conversion dataset.
Configure tracking around revenue markets. Enter the keywords, search engines, locations, and devices relevant to your customers. Operosus's guide to check your website's search rankings is a useful reference when choosing between a manual spot check and repeatable monitoring.
Archive dimensional exports on a weekly schedule. Preserve query and page extracts with date, country, device, and search type. Store aggregate totals separately so you retain a reliable comparison when detailed rows are incomplete.
Record freshness and extraction metadata. Save the extraction date, property, filters, reporting time zone, and whether the latest period is provisional. Without this record, a later analyst cannot tell a genuine performance revision from a changed extraction, and the diagnosis collapses into guesswork.
Standardize URLs before joining sources. Map redirects, parameters, and reported canonical URLs to an agreed page identifier without deleting meaningful distinctions. Join pre-aggregated datasets at the same grain, such as page, date, country, and device, to avoid multiplying totals.
Reconcile rather than force agreement. Compare Search Console headline totals with exported row sums and record the difference. Separately investigate discrepancies between search clicks and analytics sessions, because those measures describe different events.
Search Console and GA4 data limits
| Source | Limit or Retention | Practical Rule |
|---|---|---|
| Search Console interface | Maximum of 1,000 table rows, documented in Google's performance-data explanation | Use API extraction for broader query coverage rather than assuming completeness |
| Search Analytics API and Looker Studio connector | Up to 50,000 rows per day, per property, per search type, per the Search Analytics API reference | Paginate requests and document the cap |
| Search Console retention | Most recent 16 months, according to Google's performance report documentation | Archive exports before older periods drop out |
| GA4 link with Search Console | Data generally available within 48 hours, per Google's integrated reporting documentation | Exclude the latest two days from final trend reads |
Preserve the gap, not just the rows
Privacy filtering removes anonymized queries from detailed tables, although those queries generally remain in unfiltered chart totals. Label query extracts incomplete where appropriate, rather than calling them sampled when the actual issue is suppression or truncation. The distinction matters for diagnosis: sampled rows still represent the whole, while suppressed rows mean a slice of demand is invisible entirely, so the cause assigned to a query-level decline can be wrong from the start.
Don't distribute that missing traffic across visible queries to manufacture a complete picture. Use page, country, and device views to investigate patterns that query tables can't expose.
Practical rule: Store both the headline total and the dimensional extract. They answer different questions.
A pipeline without archival exports and reconciliation can look convincing until someone asks for an older comparison or a complete explanation of a long-tail decline. Treat every joined report as a diagnosis with a traceable history: each figure should point back to its source, its extraction conditions, and the gaps it contains before the team acts on it.
Reporting Frameworks and Cadence for Each Audience
A useful report answers three questions in order: Are we visible to the right audience? Are visitors completing meaningful actions? Does that activity contribute to business value? Label those layers separately because their sources and uncertainties differ.
Visibility can be observed without knowing the visitor's eventual purchase. An on-site event can be measured without establishing lead quality, while attributed pipeline depends on both CRM records and the attribution rules.
Match the report to the decision
| Cadence | Audience | Main Questions | Required Output |
|---|---|---|---|
| Weekly | SEO, content, and technical teams | Which priority pages changed? Are indexing or release problems emerging? | Affected URLs, investigation owner, next check |
| Monthly | Client or marketing lead | What changed against the comparison period? Which wins and losses matter commercially? | Diagnostic summary, outcome context, prioritized actions |
| Quarterly | Executives and budget owners | Where is tracked visibility share growing? Which topics and acquisition investments deserve resources? | Investment recommendation, topic gaps, link-growth context |
Treat the weekly view as an operating queue. Include priority keyword movements, indexing changes, and release annotations, but don't turn every fluctuation into a strategic conclusion.
The monthly report should name the page groups responsible for the largest meaningful changes. Explain whether the team should protect a gain, investigate a loss, improve conversion, or wait for stronger evidence.
The quarterly review should evaluate resource allocation. Keep the tracked keyword universe stable when comparing visibility share, and distinguish relevant referring-domain growth from a simple increase in link counts.
Force business value into stakeholder reporting
In a 2025 survey of 170 U.S. marketers, 62.9% prioritized revenue, conversion rate, and pipeline, while 31.8% connected organic growth to pipeline or revenue in stakeholder reporting, according to Omniscient Digital. That gap suggests a practical design requirement: monthly and quarterly templates need an explicit outcome field, even when the honest entry is that measurement remains incomplete.
Agencies should translate the evidence into a client narrative and recommendation. In-house teams should attach each proposed action to the person who can implement it, whether that's an editor, developer, merchandising manager, or analyst.
Every report needs a named owner and a decision it supports. A delivery schedule isn't a decision.
If commercial measurement is unavailable, report the missing connection as a measurement task. Don't substitute an engagement metric and rename it business value.
Attribution Models and Where They Mislead Organic Reports
Attributed organic revenue isn't a count of sales independently caused by SEO. It's revenue credit assigned under a model, using the interactions that the measurement system can observe.
Google's attribution documentation explains that the Attribution paths report shows touchpoints preceding key events, while data-driven attribution uses observed paths to estimate interactions' contributions. Changing how credit is allocated can therefore change organic's reported value without changing rankings, traffic, or total revenue.
Compare interpretations, not competing truths
Attribution models compared for organic reports
| Model | How It Assigns Credit | Common Misreading |
|---|---|---|
| First-click | Gives all credit to the first touchpoint | Treating awareness content as solely responsible for the eventual sale |
| Last-click | Gives all credit to the final eligible touchpoint before conversion | Ignoring organic research earlier in the journey |
| Data-driven | Allocates credit using observed path data | Treating modeled credit as a fixed, directly observed contribution |
These are comparison perspectives, not a promise that every model is selectable in the current GA4 interface. Where a first-click view isn't available as a reporting attribution option, use an appropriately labeled acquisition or external journey analysis rather than implying the measures are identical.
Say a buyer discovers a buying guide through organic search, returns through email, and later purchases. First-touch analysis emphasizes discovery, a last-click view emphasizes closure, and a data-driven view distributes credit according to its methodology.
The sale hasn't changed. The question being asked has.
For teams extending their analysis, Otter A/B's guide to measure attribution beyond last click provides context for examining journeys rather than only the closing interaction.
Audit the interpretation before changing SEO
Direct visits generally don't receive attribution credit unless the entire path is direct. Keep that rule in mind when comparing channels, especially when stakeholders assume the final visible visit automatically receives the sale.
Apply the visibility, behavior, and outcome layers independently. Keep the model, reporting scope, and date range visible on every outcome view, and record changes to those settings alongside tracking releases.
Don't add overlapping first-touch, assisted, and last-touch totals as though they represent additional unique sales. Likewise, channel credit doesn't establish incremental conversions that wouldn't have happened without that channel.
If organic's attributed value changes while search acquisition remains steady, inspect attribution settings, path composition, and event configuration before recommending content work. The correct action may be to explain a measurement change, not to repair SEO.
How to Diagnose a Traffic Change Before You Report It
A period comparison establishes that measured performance changed. It doesn't establish why, or how much of the change the team can control.
Google's account of AI search and organic click behavior describes relatively stable overall organic click volume and higher-quality clicks. Those aggregate claims don't establish what happened to an individual category, country, or query group. Diagnose the segment you're responsible for.
Test competing explanations
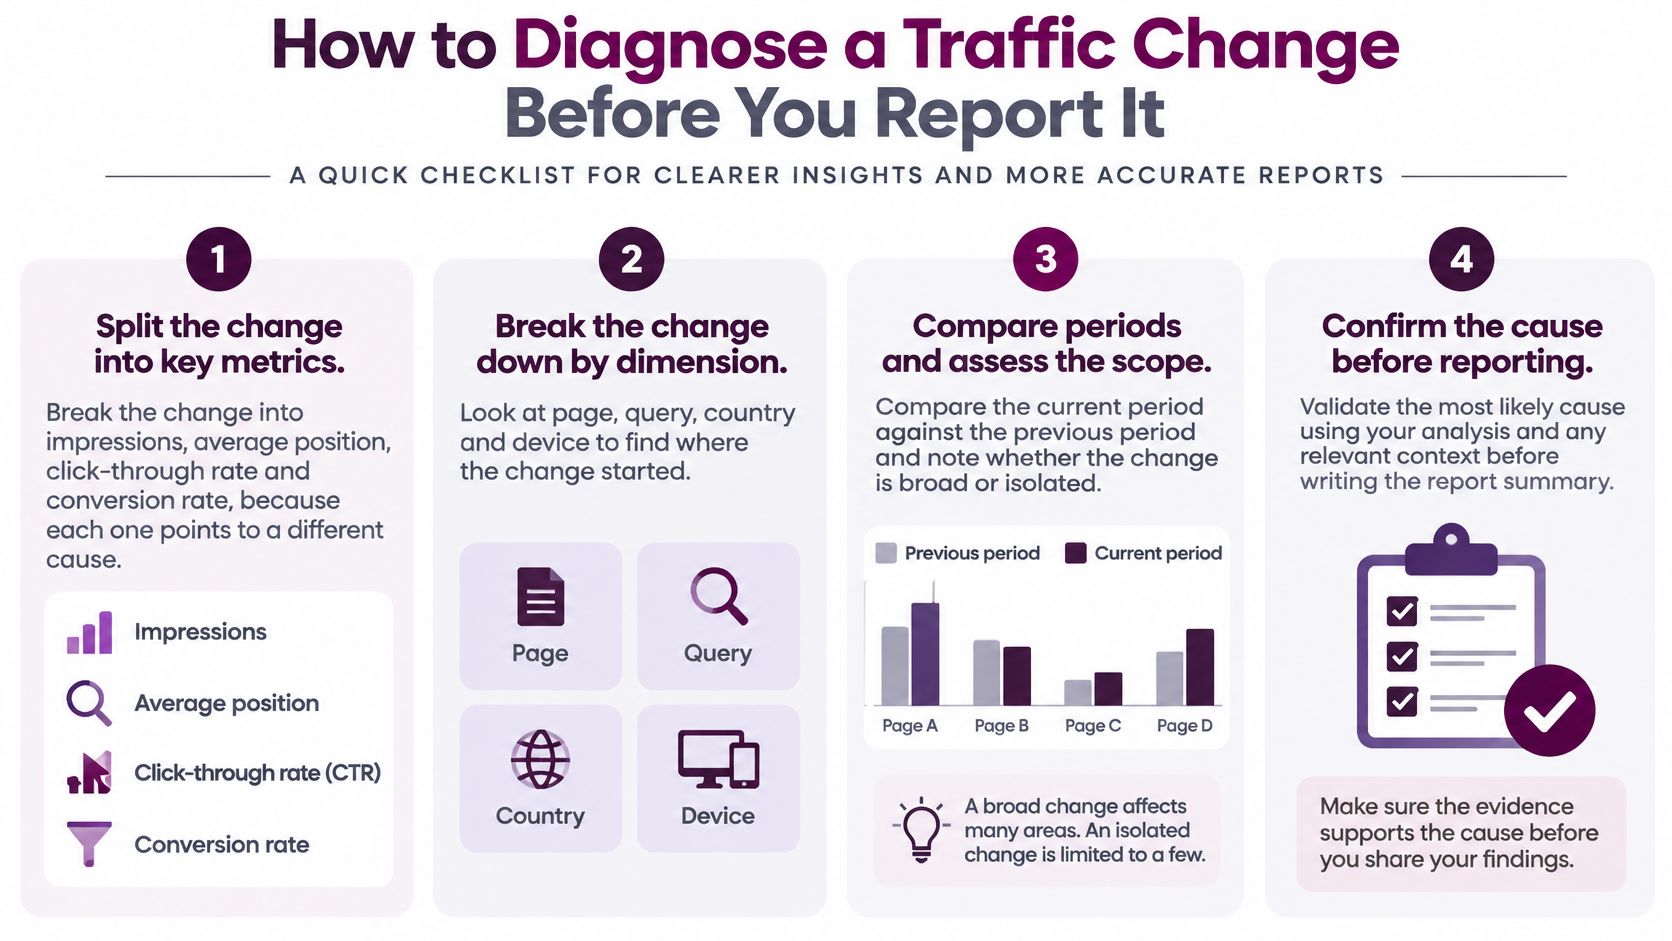
Separate the components. Inspect impressions, average position, CTR, and conversion rate rather than treating traffic as a single mechanism. Use a clearly named denominator for conversion rate, and don't divide GA4 outcomes by Search Console clicks as though both describe the same population.
Locate the concentration. Break the movement down by page, query intent, country, and device. Check whether a broad site decline is concentrated in a narrow set of landing pages.
Choose a comparison group. Match affected pages with relatively unchanged pages serving similar audiences and intent. Compare their pre-change trends before using them to assess seasonality or market-wide demand.
Inspect the change calendar. Review site releases, redirects, content edits, tracking deployments, algorithm-update timing, and search-result changes. Timing makes an explanation worth testing, not automatically correct.
Rank hypotheses by fit. Ask what each candidate cause predicts and whether the observed pattern matches. A tagging issue should leave different evidence from a loss of search visibility.
Write a bounded conclusion. State the observation, leading explanation, confidence, and next test. For example, visibility held, CTR fell on queries displaying AI answers, and measured outcomes remained stable; the relationship is suggestive, pending comparable result-page observations.
Traffic change patterns and first checks
| Pattern | Likely Cause | Check First |
|---|---|---|
| Impressions fall while position holds | Demand drop or seasonality | Compare with the same period last year and check branded search |
| Position falls across a page cluster | Ranking or technical loss | Indexing status, crawl errors, and cannibalization within the cluster |
| CTR falls while position holds | Search result features or weaker titles | New result features or AI answers on affected queries |
| Traffic holds while conversions fall | Landing-page change or tracking issue | Key-event configuration and recent page edits |
Treat the likely-cause column as a starting hypothesis, not a diagnosis. Query mix, geography, and device composition can produce similar-looking aggregates for different reasons.
Make uncertainty actionable
Matched comparisons strengthen an investigation, but they're not automatically controlled experiments. Flag weak matches, small outcome counts, and missing query coverage instead of assigning statistical confidence that you haven't calculated.
Use the 2026 organic traffic troubleshooting guide to organize deeper checks when the initial pattern remains ambiguous. Average position alone can't establish commercial damage, and a generic traffic chart can't tell a developer or editor what to change.
Alerts, Dashboards and Turning Findings Into Priorities
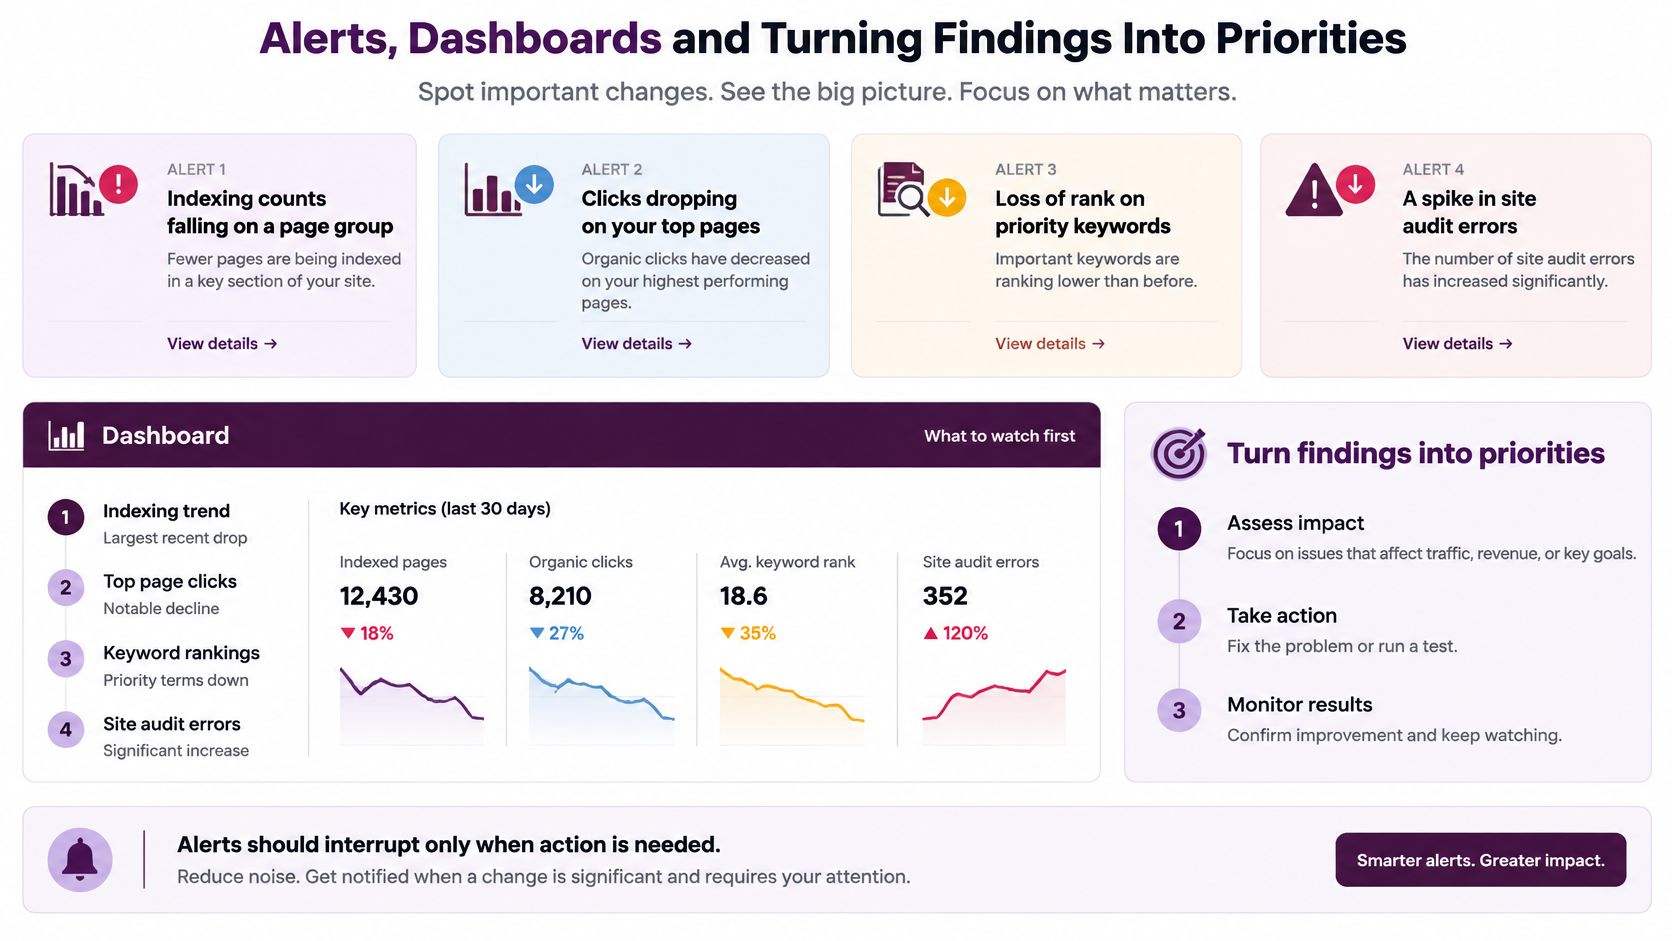
Interrupt the team when there's a plausible action to take: indexed-page counts fall within an important group, clicks decline on commercially significant pages, priority keywords lose visibility, audit errors spike, or conversions fall despite steady traffic.
Set thresholds around page groups and their normal behavior, not just the whole site. Require enough evidence to distinguish a persistent problem from an incomplete reporting period, and route each alert to someone who can investigate it.
Rank fixes by impact, evidence, and effort
A useful audit queue categorizes issues by SEO impact and implementation difficulty. Our site audit process includes an explanation, affected URLs, and actionable guidance for each issue, so the recommendation can move from diagnosis to implementation.
Say an important category page has a confirmed broken redirect path, while a low-traffic article could use a minor title improvement. Prioritize the redirect repair when it obstructs access to the destination and can be fixed directly; don't rank tasks solely by how easy they are to complete.
Use a qualitative scorecard rather than inventing precision:
- Expected impact: Which valuable pages or user journeys are affected?
- Evidence strength: Is the problem verified, or only a possible explanation?
- Implementation effort: Who must make and test the change?
- Validation plan: Which observation would show that the repair worked?
When evaluating an SEO reporting tool, check whether it preserves that decision trail instead of only displaying alerts.
Add AI exposure without inventing business value
Pew Research Center's analysis of nearly 69,000 Google searches from 900 U.S. adults in March 2025 found clicks to traditional results on 8% of searches displaying an AI Overview, versus 15% without one, as reported by The Decoder. That finding makes result-page context relevant to diagnosis, but it doesn't prove that an individual site's missing clicks became brand influence.
Record AI-answer presence, observed citations, monitored queries, observation dates, and monitoring scope. Compare branded search and downstream direct activity as supporting signals, not as automatic proof that an AI citation caused demand.
Organize the dashboard into distinct bands:
- Top band: Alert status and responsible owner for each page group.
- Middle band: Visibility, behavior, and outcomes with source labels.
- Bottom band: Open priorities, implementation status, and AI-exposure notes.
Label conclusions confirmed, supported, or unresolved, with a short explanation of the evidence. In the executive view, distinguish verified traffic loss from observed zero-click exposure, and leave unmeasured influence explicitly unmeasured.
Example Workflows and Your First Monthly Report
A finished report should make sense to someone who wasn't present during the investigation. It needs a clear finding, enough evidence to assess that finding, and an action the reader can authorize.
The following scenarios use qualitative findings rather than invented performance figures. They show how the same reporting discipline produces different deliverables for an agency client and an internal content team.
An agency report for an ecommerce client
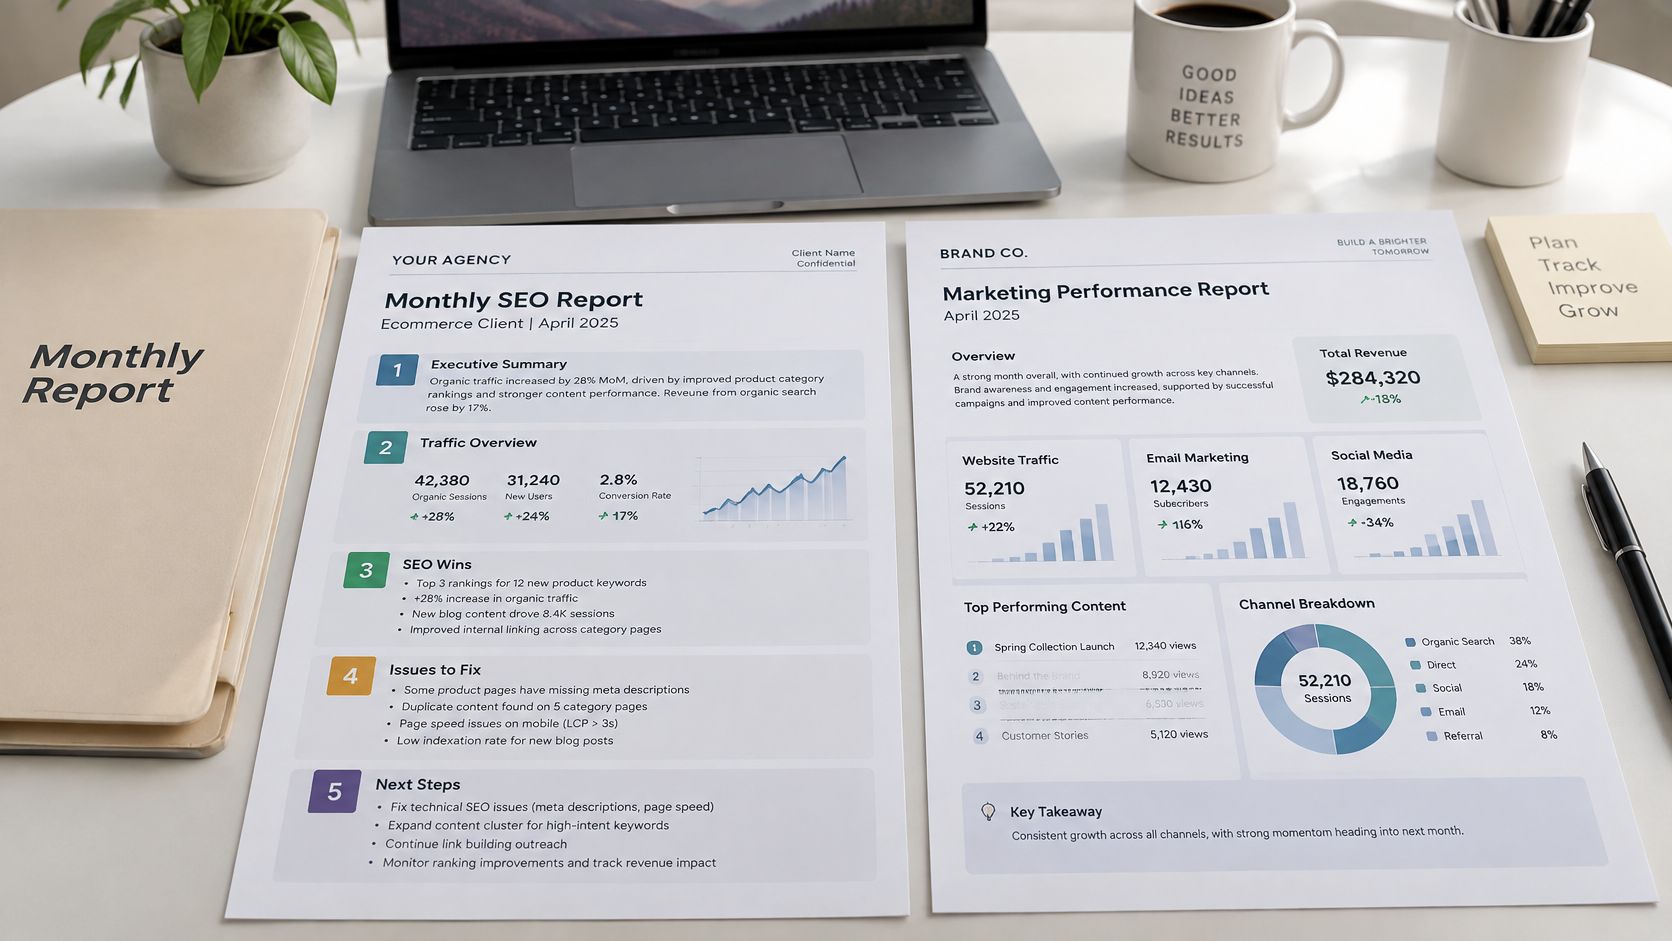
Say an agency manages organic search for an ecommerce retailer. Its analyst assembles the monthly report from archived search exports, landing-page analytics, rank tracking, and ecommerce outcomes, then presents it in the client's white-label template.
The report opens with a summary: a product-category group lost search clicks, the decline was concentrated on mobile, and the available evidence points toward changed result presentation rather than a broad indexing problem. The analyst labels the explanation provisional because historical result-page observations are incomplete.
The finished report contains these parts:
Executive summary. Name the largest commercially relevant change, the leading explanation, and the proposed decision. Don't open with a list of completed activities.
Visibility. Show impressions, CTR, and position by category, separating branded from nonbranded query groups. Identify the queries and devices contributing to the decline without suggesting the visible query rows are exhaustive.
Behavior. Show organic landing-page engagement and relevant key events for the affected category. Note whether event configuration or page templates changed during the comparison window.
Outcomes. Present ecommerce revenue under the named attribution model. Distinguish observed sales records from assigned channel credit, and identify any reconciliation work still open.
Actions. Assign a mobile result-page review to the SEO lead before the next editorial planning meeting, a template check to the developer before the next release, and measurement validation to the analyst before the next client review.
The technical appendix should connect site-health findings to the affected shopping journey. Agencies can deliver professional site health reports that communicate technical issues and their business impact, rather than expecting clients to infer the consequences from error counts.
Decision test: A client should be able to approve the next action without decoding the entire dashboard.
The report produces a specific outcome: the client approves investigation of the affected mobile query group and postpones a broad category rewrite. That restraint matters because the current evidence doesn't justify replacing content across the category.
An in-house dashboard for a content team
An internal content team needs a working page list more than a polished client narrative. Its weekly dashboard records each blog post and landing page, publication and revision dates, tracked query groups, click movement, and the responsible editor.
Suppose comparison pages lose clicks while their aggregate visibility appears stable. The analyst writes the finding as: comparison-query clicks declined while visibility held; confidence is medium, pending a result-page and query-mix check.
That statement keeps the observation separate from the suspected cause. The editor shouldn't rewrite every comparison page just because AI answers are one plausible explanation.
The team opens a focused investigation:
- SEO analyst: Compare affected query groups by device and inspect current result features.
- Content editor: Check intent alignment, product accuracy, and whether recent edits changed the page's promise.
- Analytics owner: Verify that the relevant lead events still fire and reach the CRM.
- Content lead: Hold broad production changes until the investigation identifies a useful intervention.
The action produced is a targeted review of affected pages, with a named owner and a review point. Unlike the agency report, the internal view emphasizes URL-level assignments, release annotations, and unresolved checks rather than presentation.
Build the first monthly report around a real decision
Start with a commercially important page group and keep the scope manageable. A report that can change a concrete allocation decision is more useful than a site-wide document nobody uses.
Choose the page group. Select a category, service area, or content cluster connected to revenue or qualified leads. Record which URLs belong to it so the reporting scope doesn't drift.
Name the decision. Decide whether the report will support technical repair, content refreshes, conversion work, or further investigation. Write that decision at the top of the working document.
Apply the collection routine. Connect the relevant properties, configure market-specific tracking, and preserve the extracts for that group. Don't expand the stack unless the decision requires another source.
Lock the interpretation settings. Label dates, attribution model, channel scope, and event definitions. Keep a change log so later comparisons remain interpretable.
Assign delivery and review. Name the analyst responsible for the report and the stakeholder authorized to act. Schedule the review alongside the team's planning meeting rather than sending an unowned attachment.
Remove unused metrics after a full cycle. Ask which measures influenced a decision and which created discussion without changing action. Retain diagnostic detail in the supporting workspace, not necessarily in the recurring report.
For a small team, keep the reporting set narrow and use a monthly decision rhythm with exception alerts between reviews. Our Free plan includes Search Console integration, GA4 integration, cannibalization detection, and daily rank updates; rank-tracking setup takes less than two minutes by entering keywords, choosing search engines, and specifying relevant locations.
The final test is practical: if the report can't name the next action, it isn't finished yet.
Keyword Kick brings search performance, analytics, rankings, backlinks, and technical signals into a shared workspace so your team can investigate changes and prioritize work. Visit Keyword Kick to connect your reporting sources and build a decision-focused review around your most important page group.