You open the analytics dashboard expecting routine reporting and find a sharp downward bend. Someone asks whether Google updated its algorithm. Someone else wants to refresh the affected pages immediately. Before either conversation turns into a work order, establish what fell: search visibility, clicks from that visibility, or recorded website visits.
The Moment Your Traffic Graph Breaks
The first Slack message usually contains a screenshot, not a diagnosis. The organic traffic line looks wrong, and the pressure to explain it arrives before anyone has checked the underlying data.
If you're asking, “Why did my organic traffic drop?”, resist the temptation to answer with the most recent SEO headline. An algorithm update is a hypothesis. So are weaker demand, changed search results, a deployment problem, and broken measurement. None deserves priority merely because it's familiar.
Consider a hypothetical investigation. Your content team sees fewer visits to educational articles and proposes a refresh. Yet the affected queries still generate impressions, their positions look similar, and the commercial landing pages haven't followed the same trajectory. That pattern calls for a different investigation than disappearing visibility across the site.
Separate the observation from the explanation
Start with language you could defend in a reporting meeting. “Organic traffic is down” describes an outcome, but it doesn't establish where the loss occurred or what caused it.
A more useful initial record separates:
- The observation: Which reporting system shows the decline, and which metric changed?
- The scope: Which pages, query groups, devices, or countries account for it?
- The hypothesis: What explanation would produce that particular pattern?
- The disconfirming evidence: What finding would make you reject that explanation?
This distinction prevents a common analytical mistake: treating the first plausible cause as the confirmed cause. A deployment near the decline deserves inspection, but proximity alone doesn't prove that it changed search performance.
Practical rule: Don't authorize a broad content rewrite until you can explain why the affected pages need different content.
Define a defensible diagnosis
The useful deliverable isn't a list of everything that can go wrong in SEO. It's a bounded statement about the affected segment, the metric that deteriorated, and the evidence supporting the proposed cause.
You might conclude that a particular query group lost ranking visibility. You might instead identify a click-through problem or an analytics discrepancy. Either conclusion gives the team a narrower, testable assignment.
Treat the graph as the opening observation. Your job is to explain the mechanism behind it before changing the site.
The Three Metrics That Decide Everything
Impressions, average position, and click-through rate belong together. Reading any of them alone makes it easier to prescribe the wrong fix.
Impressions describe appearances in search results. Average position helps you assess ranking movement. Click-through rate, or CTR, connects those appearances to clicks. The diagnostic question is which part of that relationship changed within the affected segment.
Use the following table as a hypothesis map, not an automatic verdict.
Match Your Drop Pattern to a Cause Family
| Impressions | Avg. Position | CTR | Likely Cause Family |
|---|---|---|---|
| Falling | Broadly stable | Broadly stable | Reduced search demand or lost visibility outside the remaining query set |
| Stable or falling | Worsening | Falling or mixed | Ranking loss, relevance changes, or stronger competing results |
| Broadly stable | Broadly stable | Falling | Changed search-result presentation or less compelling snippets |
| Rising | Stable or improving | Falling | Broader query exposure, changed query mix, or reduced click opportunity |
| Broadly stable | Broadly stable | Broadly stable | Investigate the discrepancy between search clicks and recorded visits |
These combinations are directional clues, not mutually exclusive categories. A page can lose rankings for commercial queries while gaining impressions for informational ones. A sitewide average can conceal both movements.
Compare like with like
Avoid concluding that rankings are healthy because the aggregate position improved. Instead, hold the query group, destination page, country, and device as consistent as possible.
Suppose new queries begin generating impressions but rarely produce clicks. The aggregate CTR can fall without proving that existing queries became less effective. Conversely, a stable aggregate position doesn't rule out losses among the queries that previously supplied valuable visitors.
Use a narrower comparison:
- Same queries: Assess whether established terms lost visibility or click-through.
- Same pages: Check whether the destination's search exposure changed.
- Same audience segment: Keep device and country differences from obscuring the pattern.
Google's diagnostic approach, applied in the next workflow, supports investigating affected queries rather than treating the sitewide chart as a sufficient explanation.
A useful diagnosis names the changed metric and the affected segment before it names a cause.
Write your provisional conclusion in a sentence: the affected query group retained visibility but earned fewer clicks, or the affected directory lost impressions alongside worse positions. If you can't complete that sentence confidently, keep investigating rather than selecting a remedy.
Your First 30 Minutes in GA4 and Search Console
Two tools watch the same symptom from different sides. Search Console records what happened on the results page; GA4 records what happened after the click. A decline can dominate one report and barely register in the other, and that disagreement is itself a finding. Clicks holding steady while recorded organic sessions fall points the investigation at tagging, consent, or redirect changes before it points at rankings.
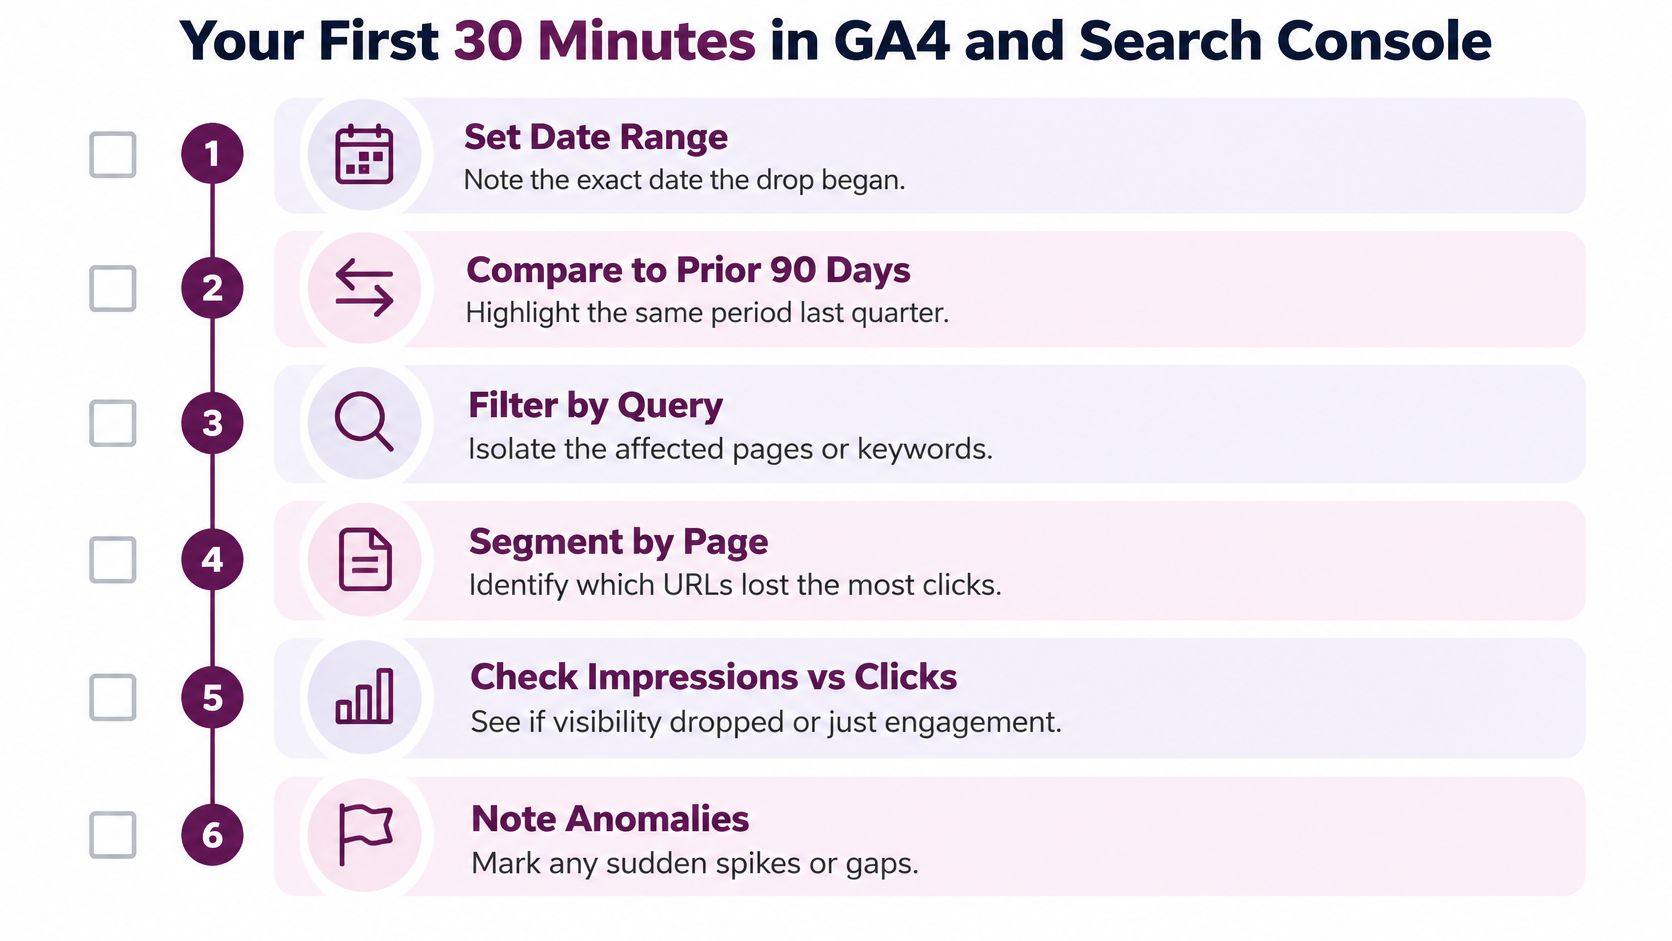
Half an hour divides cleanly into three ten-minute jobs.
| Minutes | Where you work | The question it answers |
|---|---|---|
| 0 to 10 | Search Console, performance report | When does the decline become visible, and is the break sudden or gradual? |
| 10 to 20 | Search Console, filtered comparisons | Which queries, pages, countries, and devices account for the lost clicks? |
| 20 to 30 | GA4 | Do recorded organic sessions on the same landing pages confirm or contradict the search pattern? |
Work through them in order and record findings instead of editing anything. In the first block, choose a baseline that compares equivalent periods and extends far enough back to expose seasonal repetition, since an incomplete reporting period can imitate a drop. In the second, sort candidates by clicks lost rather than percentage change; a page with a small baseline can show an alarming figure while contributing almost nothing to the decline. Group the remaining suspects by directory, template, or purpose, then apply the impressions, position, and CTR classification inside that group. Deployments, content edits, and reporting changes go into the same log as hypotheses to test.
Google's guidance for debugging search traffic drops follows a similar order: isolate the queries that lost clicks and impressions, then compare them against Google Trends to separate falling demand from a site-specific loss. If the filters and comparisons feel unfamiliar, the walkthrough to master Google Search Console for SEO in 2026 covers the reports you will be switching between.
The GA4 block exists to catch the cases where search never changed at all. Confirm the organic channel definition, inspect the affected landing pages, and check your change log for anything that altered what gets counted. Where the affected searches display AI answers, Bazzly's explanation of how AI answers get sourced gives useful context for reading that results page. Context about the SERP environment is not proof that AI caused your decline.
Thirty minutes buys you three things: an onset date, an affected cluster, and a metric signature. Anything beyond that is a remedy chosen before the diagnosis is finished.
Reading the Algorithm Update Signature
Suppose a site loses a third of its organic clicks during the same week Google confirms a core update rollout. That overlap earns the update a place on the suspect list. It doesn't earn a conviction. A decline that begins two days inside a rollout window can still trace back to a template deployment shipped that same week.
Google's documentation describes ranking as a system that changes over time: core updates and smaller adjustments can reorder which pages perform best for a given query. A drop doesn't automatically mean something broke on your site. A page can remain indexed and valid while competing results serve the search better. The operational consequence follows directly: if the affected pages still index and render, rechecking their tags will not explain why different results displaced them.
What separates a signal from a coincidence
Run the update hypothesis through four checks before committing to it.
| Check | Supports an update cause | Weakens an update cause |
|---|---|---|
| Timing | The decline overlaps a documented rollout window | Losses began before the rollout or cluster around a deployment |
| Ranking | The affected query cohort lost positions | Positions held while clicks fell, which redirects the investigation toward the results page |
| Page pattern | Losing pages share a weakness relevant to their queries | Losses scatter across unrelated templates and topics |
| Alternatives | Demand, deployments, and tracking changes fail to explain the pattern | One of them reproduces the onset date and the affected cluster |
A passed check still leaves the targeting question open. Labels such as "quality," "authority," or "E-E-A-T" describe aspirations, not findings. The diagnosis needs a named shortcoming: missing evidence, outdated guidance, or an answer that no longer matches what the query asks.
Scope narrows the hypothesis further. A decline confined to one template calls for a template investigation before any sitewide quality program. The same discipline applies to backlinks and credibility signals: they count only where they connect to the affected pages and the observed timing. An unrelated backlink fluctuation is noise wearing the costume of a cause.
Once the ranking-loss pattern is established, the SEO action plan for 2026 algorithm shifts helps organize the page-level response. The work is prioritizing fixes that match observed weaknesses rather than rewriting everything the update window happened to touch.
Past rankings are a historical observation, not a promise that the same page will retain the same visibility.
A sound update diagnosis also states its limits. You can hold evidence consistent with a ranking-system change without ever learning the weighting behind it. That conclusion stands, provided the remediation targets weaknesses you observed rather than requirements you imagined the algorithm to have.
The CTR Problem Most Guides Miss
A page can keep position 3 and lose a third of its clicks. When that happens, the ranking model is the wrong place to start, because the scarce asset was never position alone. It was the click that position used to create. Separate impressions, position, and CTR before naming any cause; otherwise a CTR problem gets priced as a content failure.
Pew Research Center's analysis of Google browsing behavior examined nearly 69,000 searches from March 2025 and found traditional-result clicks in 8% of visits with an AI summary, compared with 15% without one; users also ended the session on Google in 26% of visits with a summary versus 16% without one. That is enough evidence to stop treating every traffic fall as a ranking event. It is not enough to convict AI summaries in your own account.
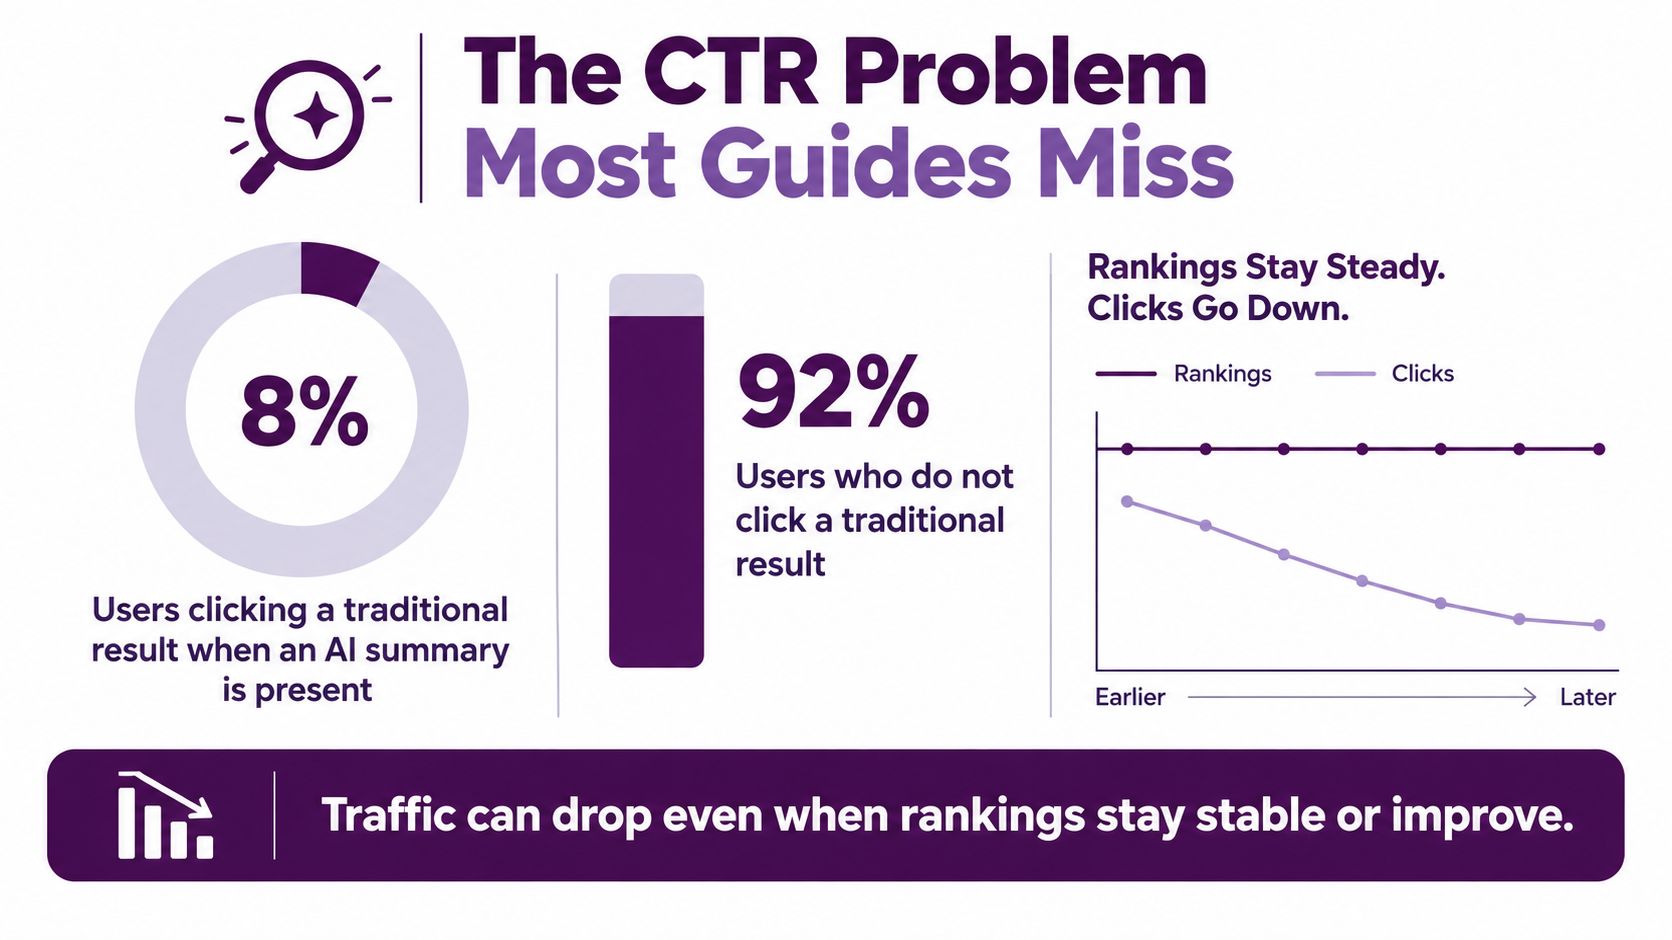
Read the affected queries as three rows in one ledger. Row one is exposure: impressions rose, held, or fell. Row two is position: the URL gained, held, or slid. Row three is yield: CTR moved independently of the first two. A decline with stable position and stable impressions belongs to the third row until the evidence says otherwise.
Then add the field Search Console will not give you: what occupied the results page around your listing during the same window. Mark AI summaries, featured snippets, local packs, video rows, product carousels, forum blocks, or a stronger snippet above you. Compare exposed queries with near neighbors that share intent and device mix. If the exposed group sinks while its neighbors hold, feature substitution becomes a working hypothesis. If both groups sink together, look toward demand, seasonality, tracking, or a wider relevance problem.
An observational split still has limits. You are comparing similar queries, not running a controlled experiment, so treat the feature as a suspect with opportunity rather than a proven cause. If the feature appeared only when you first looked for it, record that as first sighting, not launch date.
Once CTR is isolated, the response splits by constraint. Weak snippet relevance calls for title and description tests; the playbook on how to boost click-through rates fits that lane. A fully answered informational query has a different ceiling, so the better investment may be the next task in the chain: comparison detail, implementation steps, original evidence, pricing context, or product-specific requirements. Brand demand and conversion quality can absorb part of the loss; the evidence still points first at reduced click opportunity. Measure recovery as CTR regained on exposed queries, not as position alone.
Technical, Content, and Tracking Causes Worth Ruling Out
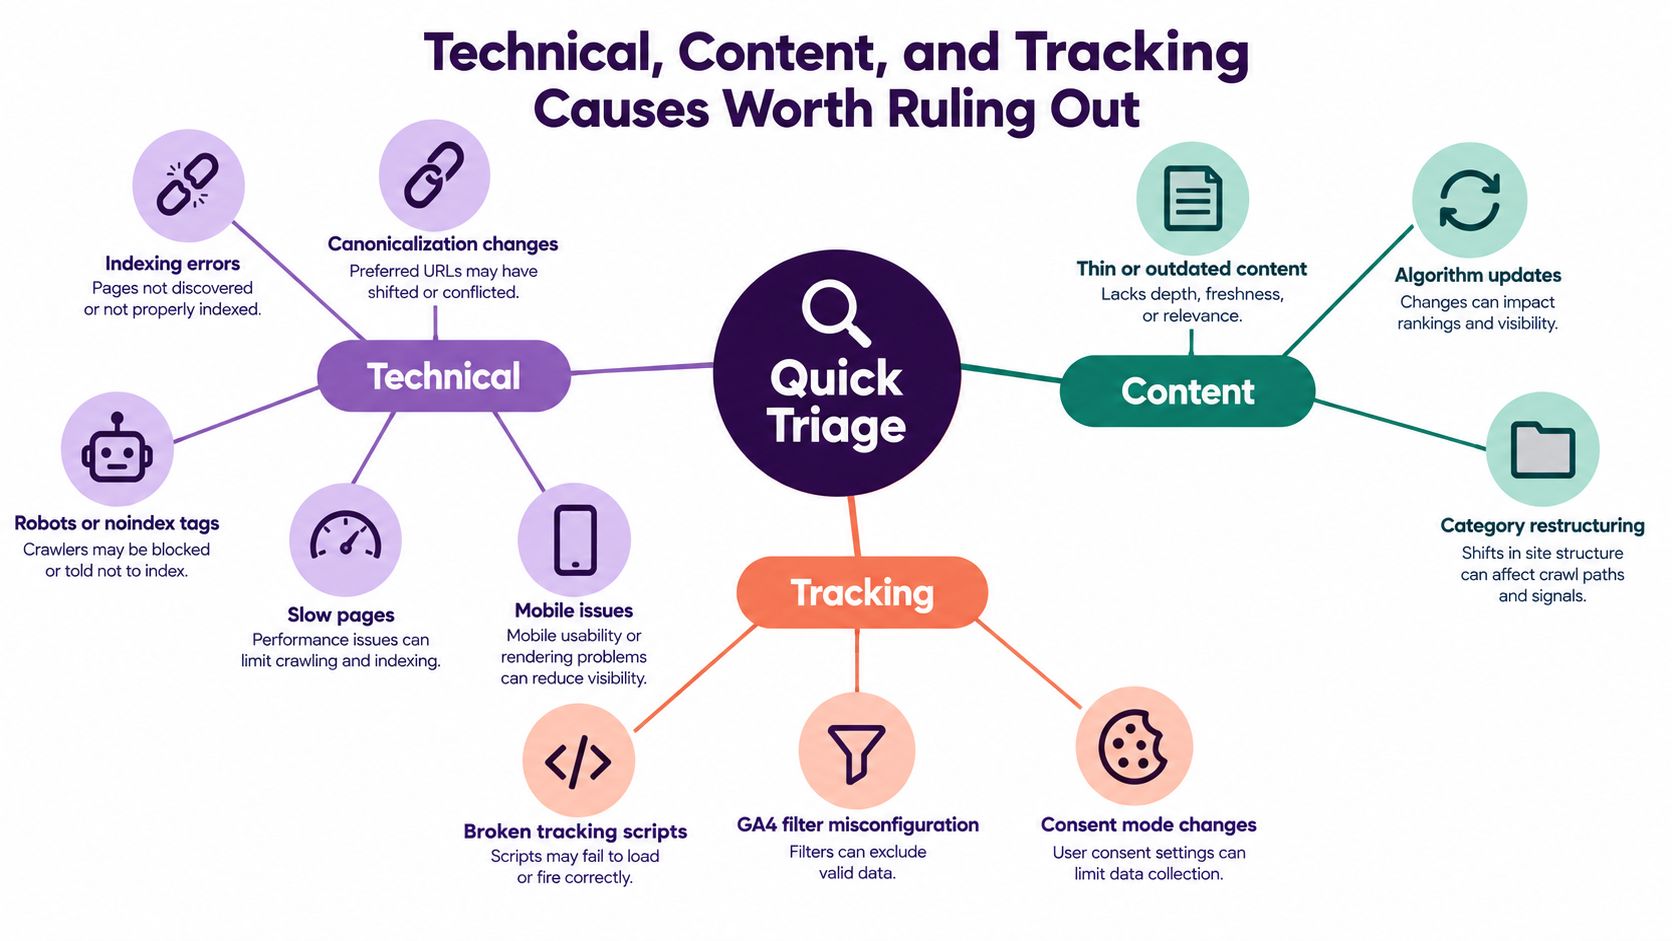
Use the affected cluster to narrow your checks. A mobile-only decline calls for different inspection than a discrepancy confined to GA4. A category-directory loss calls for different inspection than weaker CTR across otherwise stable informational queries.
The following checks are tests to perform, not claims that each issue caused your decline.
Technical checks tied to affected URLs
Inspect representative losing URLs and compare them with unaffected pages using the same template.
| Check | Evidence to look for |
|---|---|
| Indexing and access | Changed indexing status, unexpected exclusions, or an inaccessible destination |
| Canonicalization | A selected canonical that differs from the intended ranking URL |
| Robots and noindex | A restriction introduced on an affected page or template |
| Redirects | An unexpected destination, broken route, or lost equivalent landing page |
| Mobile rendering | Missing content or unusable elements in the affected mobile experience |
| Performance | A deterioration in page experience that overlaps the affected template and onset |
A poor performance score alone doesn't prove the cause of a search decline. Establish whether the timing and affected URLs match before elevating it above competing explanations.
For SaaS teams investigating template and crawlability questions, SubmitMySaas technical SEO insights provides a supplementary review resource. Use your own URL evidence to decide which checks warrant remediation.
Content and intent checks
Compare losing pages with their previous versions and with the results now serving those queries. Look for information that became outdated, removed sections, changed page purposes, or consolidation that no longer answers the original need.
Inspect pruning and restructuring decisions in particular. Ask whether an old URL's replacement serves the same audience and task. Don't label a page “thin” merely because it's short, or diagnose topical authority erosion without identifying what relevant coverage or evidence is missing.
Tracking and reporting checks
Verify that the Search Console property matches the site version you intend to analyze. In GA4 and Google Tag Manager, inspect recent changes to tags, consent behavior, channel configuration, and landing-page measurement. Test redirects and CDN behavior when the discrepancy follows a deployment.
Remember that Google's Search documentation updates note AI Overviews are included within existing Search Console Performance reporting rather than a separate metric. Don't search for a dedicated AI Overview report as a prerequisite for completing this investigation.
The standard for clearing a suspect is concrete: inspect the relevant configuration, compare affected and unaffected pages, and record what supports or contradicts the hypothesis.
Prioritized Fixes and How to Measure Recovery
Prioritize the verified problem by impact, effort, and confidence, not by how alarming its label sounds. An obvious reporting fault may deserve immediate attention, while a speculative sitewide content overhaul should wait.
Match the intervention to the evidence
- Restore measurement and access integrity. Correct confirmed tagging, redirect, indexing, or canonical problems first. Preserve a record of the change so you can evaluate its effect.
- Address demonstrated click-through constraints. Test clearer titles and descriptions where the listing is unpersuasive. Where the search experience itself limits clicks, evaluate deeper-intent opportunities rather than promising a ranking fix will restore the old baseline.
- Repair content-task mismatches. Refresh demonstrably outdated information, restore useful material removed during consolidation, and improve evidence where competing pages better answer the query.
- Treat update-related work as specific remediation. Assign changes to documented page weaknesses, not broad instructions to improve quality.
Separate corrective work from strategic investment. Fixing an unintended noindex instruction addresses a fault. Building demand for your brand is a different initiative with different evidence and evaluation needs.
Define recovery before implementing changes
Record the affected query and page cohort, the comparison period, and the metric you expect the intervention to improve. State what would count against your hypothesis as well as what would support it.
Track impressions, position, and CTR independently within that cohort. Add relevant conversions or revenue where measurement supports them, but don't use stable business outcomes to dismiss a verified visibility problem.
Choose a reassessment window appropriate to the change and allow enough observation to avoid reacting to routine fluctuation. Where practical, stage interventions so you can distinguish their effects instead of launching unrelated changes together.
Recovery criterion: The diagnosed failure improves in the affected segment, not merely somewhere in the sitewide average.
A useful recovery report explains what changed, what improved, and what remains uncertain. That gives stakeholders a defensible decision about the next action, even when total traffic hasn't returned to its previous level.
Keyword Kick offers a shared workspace for GA4, Search Console, rankings, backlinks, technical audits, and SERP signals, with its K² AI Agent providing prioritized recommendations. Visit the platform to investigate your affected pages and queries together, then turn the evidence behind your traffic decline into a focused action plan.